
Please review my IELTS writing task 1. Thank you!
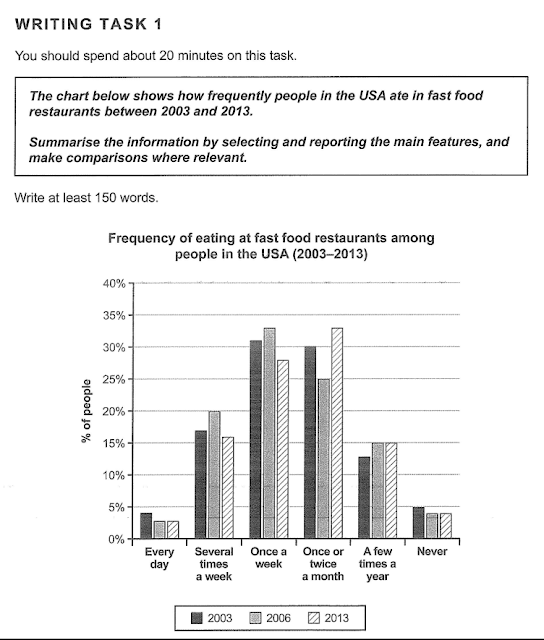
The bar chart presents the percentages of Americans who had meals at fast-food restaurants at different levels of frequency in the years 2003, 2006, and 2013.
Overall, a majority of Americans consumed fast-food on a weekly and a monthly basis, whereas the segments of those who ate fast-food daily, and who never ate fast-food were relatively small.
The proportions of American people eating fast-food once a week, and several times a week were 31%, and 17% respectively. These proportions increased slightly in 2006 and then decreased to 28%, and 15% in 2013. In contrast, there were 30% of people in the US having fast-food once or twice a month, followed by a decline of 5% in 2006 and a rise to around 33% in 2013.
There was approximately 4% of the US citizens who had fast food every day, which went down moderately to 3% in 2006, and 2013. Similarly, the percentage of those who never ate fast food was 5% in 2003 and declined marginally to 4% in the following three, and ten years.
Top answer
The bar chart presents the percentages of Americans who had meals at fas t-f ood (no hyphen) restaurants at different levels of frequency in the years 2003, 2006, and 2013. (Incomplete. How many frequencies and what were they?
- The bar chart presents the percentages of Americans who had meals at fas t-f ood (no hyphen) restaurants at different levels of frequency in the years 2003, 2006, and 2013.
- (Incomplete.
- How many frequencies and what were they?
- ) Overall, a majority (Majority means more than 50%.
- There is no bar on this chart with a value of 50% or more) of Americans consumed fast-food on a weekly and a monthly basis, whereas the segments of those who ate fast-food daily, and who never ate fast-food were relatively small.
Get the Weekly English Kit 📬
New words, one handy idiom, and a 2-minute quiz — delivered to your inbox to keep your streak alive.
The bar chart presents the percentages of Americans who had meals at fast-food (no hyphen) restaurants at different levels of frequency in the years 2003, 2006, and 2013. (Incomplete. How many frequencies and what were they? )
Overall, a majority (Majority means more than 5
 Related Questions