
Please review my IELTS writing task 1. Thank u!!!!
The chart below shows the results of a survey about what people of different age groups say makes them most happy.
Summarise the information by selecting and reporting the main features, and make comparisons where relevant
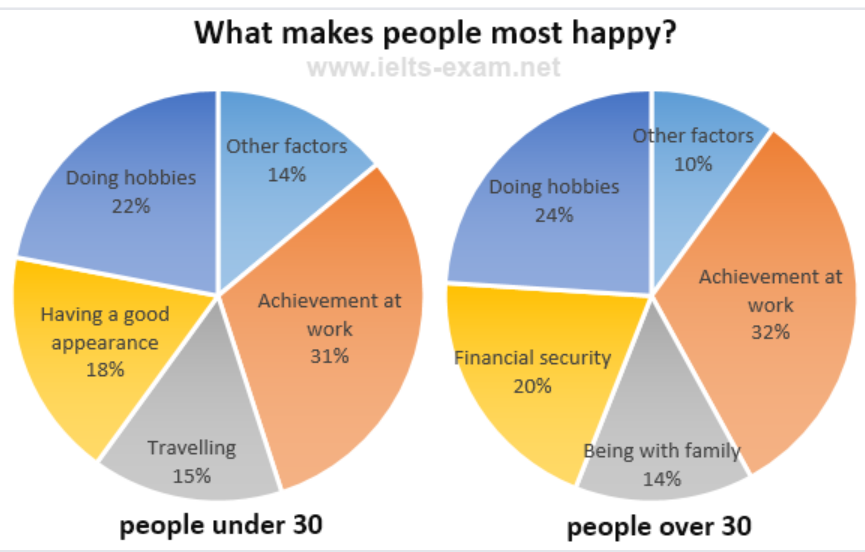
The pie chart illustrates the cause of happiness from 2 different generations, including people under 30 years old and over 30 years old.
Overall, it is apparent that, despite the age gap, people gain the most pleasure from achievement at work. Another visible trend is that there are similar trends that make younger and older people feel happy.
In terms of the same factors, the proportion of people who feel happy from work accounts for 30% both the young and the old. Similarly, people under 30 said that doing their own favorite is the most significant with 22%, compared to 24% with the elder.
Turning to the difference, 18% of people under 30 said that having a good outside appearance is another important purpose, while 20% of people over 30 consider financial security and salary maintenance more vital. Also, travelling seems to bring happiness for 15% of people under 30, whereas, people over 30 are more interested in spending time with their family more, for 19%. Respectively, 19% of people under 30 and 10% of people over 30 consider other factors as a way for happiness.
Top answer
The two pie chart s illustrates the cause of happiness from 2 different generations, including compare people under 30 years old and with those over 30 years old , in terms of four things that make them most happy . Overall, [ 1 ] it is apparent that, despite the age gap, people gain both groups derive the most pleasure from achievement at work, and the proportions for the other categories were similar in both charts. Another visible trend is that there are similar trends that make younger and older people feel happy .
- The two pie chart s illustrates the cause of happiness from 2 different generations, including compare people under 30 years old and with those over 30 years old , in terms of four things that make them most happy .
- Overall, [ 1 ] it is apparent that, despite the age gap, people gain both groups derive the most pleasure from achievement at work, and the proportions for the other categories were similar in both charts.
- Another visible trend is that there are similar trends that make younger and older people feel happy .
- In terms of the same factors, th e proportion Around a third of people in both age groups who feel happy from find professional achievements most satisfying.
- work accounts for 30% both the young and the old.
Get the Weekly English Kit 📬
New words, one handy idiom, and a 2-minute quiz — delivered to your inbox to keep your streak alive.
The two pie charts illustrates the cause of happiness from 2 different generations, including compare people under 30 years old and with those over 30 years old,
 Related Questions