
Please review my IELTS writing task 1. Many thanks
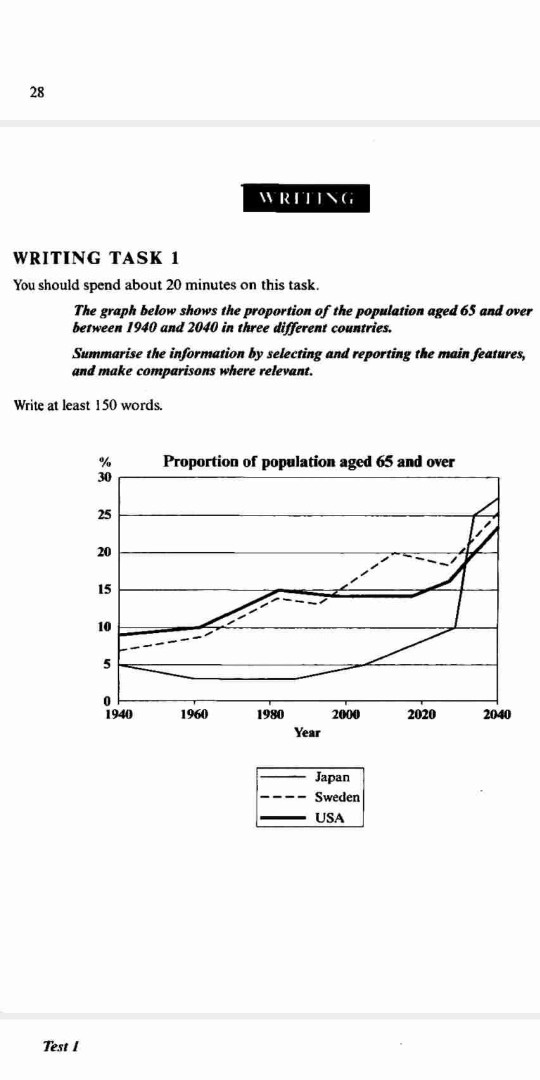
The chart gives information about the percentage of the population aged at least 65 over the course of a century, starting from 1940, in Japan, Sweden and the USA.
Looking at the graph, it is obvious that the proportions of old people in all the three countries are expected to rise in the future, although they have experienced different trends since 1940.
According to the statistics, there was nearly 10% of the population in the USA who were 65 years old or more, while the percentage in Sweden and Japan was 7% and 5%, respectively. After a 40-year period of increase, the proportion in America has maintained the same level annually since 1980 at 15%, whereas it has remained a steady growth in Sweden, which is predicted to hit 25% in 2040. However, experts also expect that it will surpass 20% in the US in the future.
On the other hand, a relatively remarkable decrease in the proportion of old people could be shown from 1940 to the 1980s in Japan. Nevertheless, since then, the percentage has risen significantly, which passed the same level in 1940 20 years later. It is predicted to keep growing more tremendously in the following years, surpassing 10% in the 2020s and skyrocketing to 27% less than two decades later.
WRITE DESCRIPTION HERE
Top answer
The chart (This is not a pie chart of bar chart. ) gives information about (vague, imprecise) plots the percentage of the 65-and-over population aged at least 65 over the course of a century, starting from 1940, in Japan, Sweden and the USA. ) shown different trends since 1940.
- The chart (This is not a pie chart of bar chart.
- ) gives information about (vague, imprecise) plots the percentage of the 65-and-over population aged at least 65 over the course of a century, starting from 1940, in Japan, Sweden and the USA.
- ) shown different trends since 1940.
- Japan, with the lowest of the three in 1940 is forecast to have the highest in 2040.
- According to the statistics, (Unnecessary verbiage) In detail, in 1940, there was nearly 10% of the population in this age group in the USA who were 65 years old or more, while the percentages in Sweden and Japan were 7% and 5%, respectively.
Get the Weekly English Kit 📬
New words, one handy idiom, and a 2-minute quiz — delivered to your inbox to keep your streak alive.
The chart (This is not a pie chart of bar chart. Use correct names.) gives information about (vague, imprecise) plots the percentage of the 65-and-over population aged at least 65 over the course of a century, starting from 194
 Related Questions