
Please review my IELTS writing task 1 - line graph
The graph below shows average carbon dioxide (CO2) emissions per person in the United Kingdom, Sweden, Italy and Portugal between 1967 and 2007
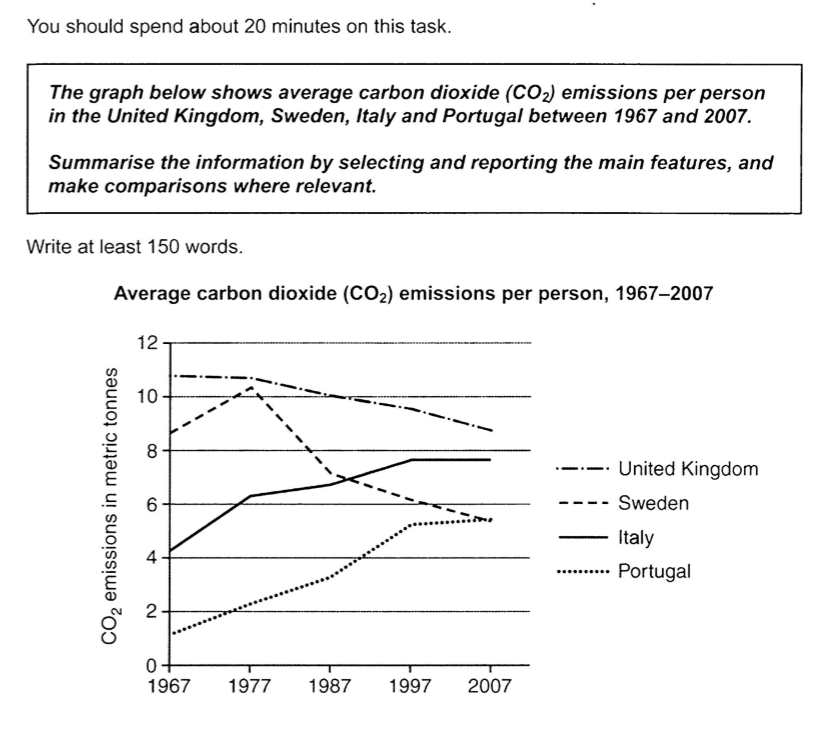
The line graph compares the amount of carbon footprint per person in UK, Sweden, Italy and Portugal from 1967 to 2007
Overall, average carbon dioxide emissions in the UK and Sweden tend to decrease, while there was an upward trend in Italy and Portugal
In 1967, each person in the UK released at approximately 11 tonnes of emissions, compared to nearly 9 tonnes in Sweden. Over the next 10 years, the amount of CO2 in Sweden reached its peak at around 10 tonnes, whereas the number of gasses in UK slightly declined. From 1977 to 2007, the average CO2 in UK and Sweden gradually fell until stood at 9 tonnes and 5.5 tonnes respectively.
Around 4 tonnes of gasses were come out in Italy in 1967, then it increased moderately until peaking at nearly 8 tonnes. In the following 10 years, it remained stable. More than 3 tonnes of emissions were released in Portugal in 1967. Afterward, it reached its highest point in 1997, then leveled off in the rest of the period
Top answer
quynhnghi tonnu; I have given you a lot of feedback. You have not acknowledged much. I feel abused by an ungrateful student.
- quynhnghi tonnu; I have given you a lot of feedback.
- You have not acknowledged much.
- I feel abused by an ungrateful student.
Get the Weekly English Kit 📬
New words, one handy idiom, and a 2-minute quiz — delivered to your inbox to keep your streak alive.
quynhnghi tonnu;
I have given you a lot of feedback. You have not acknowledged much. I feel abused by an ungrateful student.
Please post essays just in our essay forum:
https://www.englishforums.com/English/EssayReportCompositionWriting/Forum9.htm
I guess you have been informed about this issue before!
Thread Moved!
 Related Questions