
Please review my IELTS writing task 1 - line graph
The graph below gives information about changes in the birth and death rates in New Zealand between 1901 and 2101.
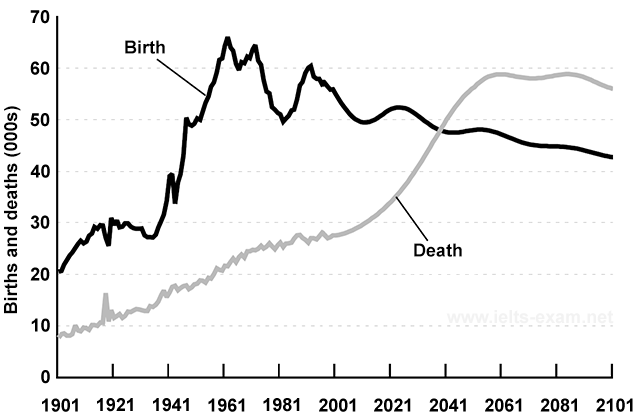
The line graph makes a comparison between the fertility and mortality rates in New Zealand from 1901 to 2101.
Overall, both birth and death rates increased over the period shown
In 1901, the birth rates started at 20,000, which doubled the death rates. Between 1901 to 1961, the fertility rate fluctuated dramatically and first peaked at nearly 70,000 in 1961. And reached its second highest point at 63,000 in 1975, followed by a brief dip to 50,000 in 1981. Then it rose again to 60,000 in 1991. While the was a gradual fluctuation in the death rate. From 1901 to 1991, it trebled from 10,000 to 30,000, which was lower than the rate of birth
Between 2021 to 2101, the fertility rate is expected to fall, in contrast, there will be an upward trend in the rate of death. The birth rate will gradually decrease to nearly 40,000 in 2101. In contrast, the mortality rate will tend to enhance and peak at approximately 60,000 in 2051 and 2091
Get the Weekly English Kit 📬
New words, one handy idiom, and a 2-minute quiz — delivered to your inbox to keep your streak alive.
 Related Questions