
Please review my IELTS writing task 1 essay. Thank you so much!
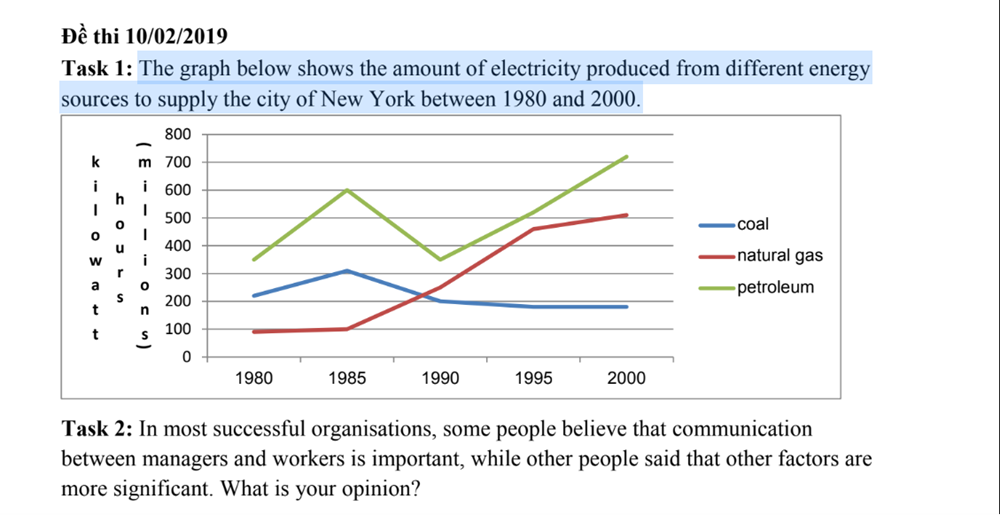
The line graph illustrates the figure for the electricity made from three sources of energy to contribute to New York City from 1980 to 2000.
Overall, the amount of electricity that is produced from coal and petroleum significantly fluctuated while there was a rise in the figure for natural gas in a period of 20 years. In addition, petroleum was always the source that had the highest productivity in all the time surveyed.
In the year 1980, around 350 kWh of electricity was made from petroleum, compared to about over 200 kWh from coal and slightly under 100 kWh from natural gas. In the next ten years, while the amount of electricity produced by natural gas rose by approximately 250 kWh, the figure for petroleum and coal considerably decreased. In 1990, electricity from petroleum and coal felt to under 350 kWh and 200 kWh respectively.
Until 2000, the amount of electricity made from petroleum and natural gas reached a peak of over 700 kWh and 500 kWh respectively whereas coal experienced a slight decrease to under 200 kWh.
Top answer
The line graph illustrates (wrong word - "illustrate" means to make a picture. Use this word for diagrams, maps and other graphics that are picture. ) the figure (wrong word.
- The line graph illustrates (wrong word - "illustrate" means to make a picture.
- Use this word for diagrams, maps and other graphics that are picture.
- ) the figure (wrong word.
- This word is often misused in these essays.
- "Figure" means a value or quantity primarily in the context of business reporting.
Get the Weekly English Kit 📬
New words, one handy idiom, and a 2-minute quiz — delivered to your inbox to keep your streak alive.
The line graph illustrates (wrong word - "illustrate" means to make a picture. Use this word for diagrams, maps and other graphics that are picture. ) the figure (wrong word. This word is often misused in these essays. "Figure" means a value or quantity primarily in the context of business r
 Related Questions