
Please review my ielts writing task 1 and give mark for my writing
Task 1: The line graph below shows the production of paper, wood pulp and sawn-wood in the UK from 1980 to 2000.
My essay:
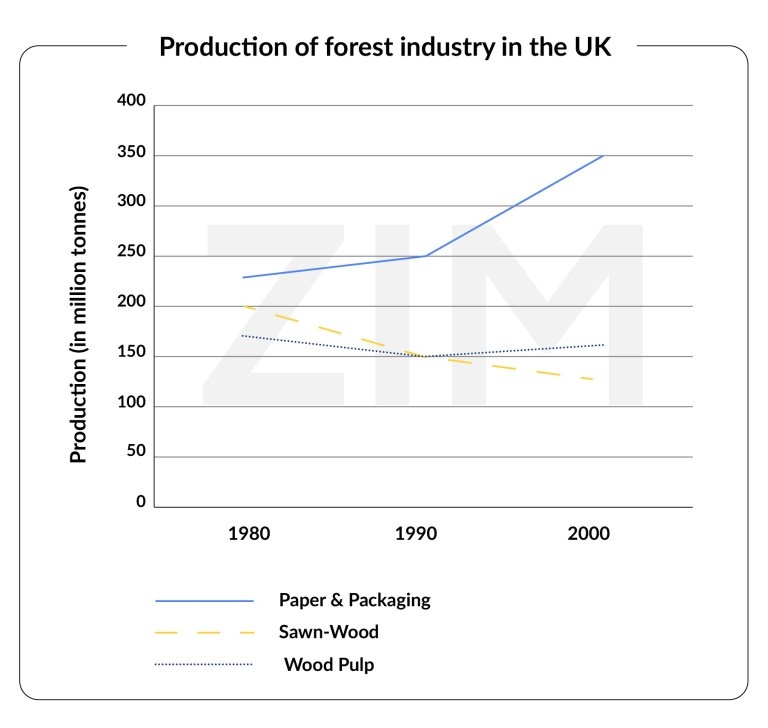
The line graph illustrates the production of forest-based industry in the UK between 1980 and 2000.
Overall, it can be seen from the graph that the production of paper and packaging experienced a significant increase during the 20-year period, while the opposite pattern was true for the production of sawn-wood and wood pulp. And also, the manufacture of paper and packaging had the greatest position among the three mentioned ones.
In the first ten years, the amount of paper and packaging produced slightly went up, from 230 to 250 million tonnes. Thereafter, the figure suddenly climbed to 350 million tonnes, which is almost one-and-a-half greater than the former number.
However, the story was different when it comes to the production of sawn-wood and wood pulp. Starting at 200 million tonnes in 1980, the amount of sawn-wood product saw a gradual decrease to 150 million tonnes by 1990 and continued to fall to only 130 in the next ten years. The pattern of wood pulp’ production is more complex. The figure fell from 175 to 150 million tonnes by 1980, whereas in the remaining period, it recovered and increased to 170 million tonnes.
Top answer
Do you still need help with that?
- Do you still need help with that?
Get the Weekly English Kit 📬
New words, one handy idiom, and a 2-minute quiz — delivered to your inbox to keep your streak alive.
The line chart displays the production of paper, wood pulp, and sawn wood in the UK from a forest industry from the year 1980 to 2000
Overall, it is notable that, there was a dramatic upward trend in the production of paper. In 1980 UK produced 230 million tonnes of paper and packaging and are rose slightly to 250 million tonnes during the year 1990.In 2000, the amount o
 Related Questions