
Please Review My IELTS Writing Task 1.
My essay:
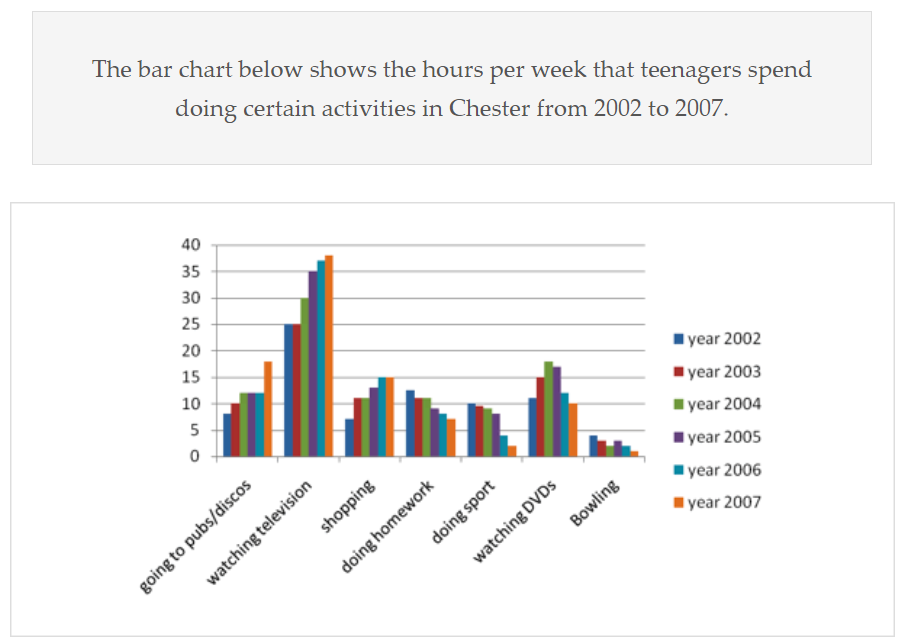
The chart compares the time that teenagers spend weekly doing seven different activities: going to pubs, watching television, shopping, doing homework, doing sport, watching DVDs and bowling for each year between 2002 and 2007 in Chester.
Overall, the hours that teenagers spent going to pubs, watching television and shopping increase every single year from 2002 to 2007. And majority of their time spent watching television.
In detail, watching television was an activity that teenagers spent the most time in six years, was about 20 hours weekly in 2002, and continued to increase to around 38 hours in 2007. About 8 hours per week they spent going to pubs in 2002, and rose to approximately 12 hours in 2004 that remained unchanged until 2006. For shopping and watching DVDs, they spent about 7 hours and 11 hours per week respectively in 2002, but in 2007, the former increased nearly double, the latter decreased by a hour. In 2002, the teenagers spent weekly about 12 hours doing homework, 10 hours doing sports and 4 hours bowling, and these activities reduced gradually for five following years.
Top answer
The [ 1 ] bar chart compares the time that teenagers [ 2 ] in Chester spend weekly doing on seven different activities: going to pubs, watching television, shopping, [ 3 ] doing h omework, doing s port, watching DVDs and bowling for each year between 2002 and 2007. in Chester. Overall, the hours that teenagers spent going to pubs, watching television and shopping increas e d every single year over that period.
- The [ 1 ] bar chart compares the time that teenagers [ 2 ] in Chester spend weekly doing on seven different activities: going to pubs, watching television, shopping, [ 3 ] doing h omework, doing s port, watching DVDs and bowling for each year between 2002 and 2007.
- in Chester.
- Overall, the hours that teenagers spent going to pubs, watching television and shopping increas e d every single year over that period.
- from 2002 to 2007.
- And [ 4 ] majority of their time spent watching television was the dominant activity throughout .
Get the Weekly English Kit 📬
New words, one handy idiom, and a 2-minute quiz — delivered to your inbox to keep your streak alive.
The [ 1] bar chart compares the time that teenagers [ 2] in Chester spend weekly doing on seven different activities: going to pubs, watching television, shopping, [ 3] doing
 Related Questions