
Please review my IELTS Writing Task 1
Topic:
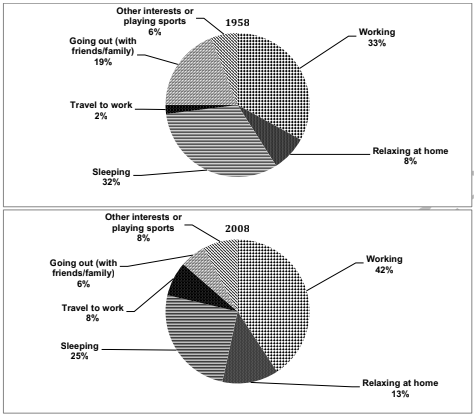
The charts below show the percentage of time working adults spent on different activities in a particular country in 1958 and 2008.
My essay:
The two pie charts compare the change in allocation of daily time of working people for a variety of activities in 1958 and 2008.
It is clear that people spent the majority of time on working regardless of which years were. In 2008, adults tended to spare less time for sleeping and entertaining activities in comparison with 1958.
In 1958, working people achieved a balance in work, pastime, and sleep with around eight hours per day for each. However, in 2008, they were likely to be busier than in the previous period. Specifically, the time for work, which went up to twelve hours, was twice as much as that for either rest or recreation.
Regarding pastime, the ratio of total hours spent outdoor and indoor activities was 3 in 1958, yet it has plummeted to 1 in 2008. Additionally, the time for sleep was in a downward trend that people spent only six hours in 2008 instead of over eight hours in 1958.
(163 words)
Top answer
The two pie charts compare [ 1] the change in allocation of daily how working individuals in some country allocated their time of working people for a variety of activities in 1958 and 2008. It is clear that people [ 2 ] time spent the majority of time on working regardless of which accounted for the highest percentage, and sleeping for the second-highest, in both year s. were.
- The two pie charts compare [ 1] the change in allocation of daily how working individuals in some country allocated their time of working people for a variety of activities in 1958 and 2008.
- It is clear that people [ 2 ] time spent the majority of time on working regardless of which accounted for the highest percentage, and sleeping for the second-highest, in both year s.
- were.
- In 2008, adults tended to spare less time for sleeping and entertaining activities in comparison with 1958.
- In 1958, working people achieved a balance in between work, pastime activities , and sleep rest with around eight hours per day for each , and commuting to work only took 2% of people’s time.
Get the Weekly English Kit 📬
New words, one handy idiom, and a 2-minute quiz — delivered to your inbox to keep your streak alive.
The two pie charts compare [ 1] the change in allocation of daily how working individuals in some country allocated their time of working people for a variety of activities in 1958 and 2008.
It is clear that people [ 2] time spent the ma
 Related Questions