
Please review my IELTS Writing Task 1
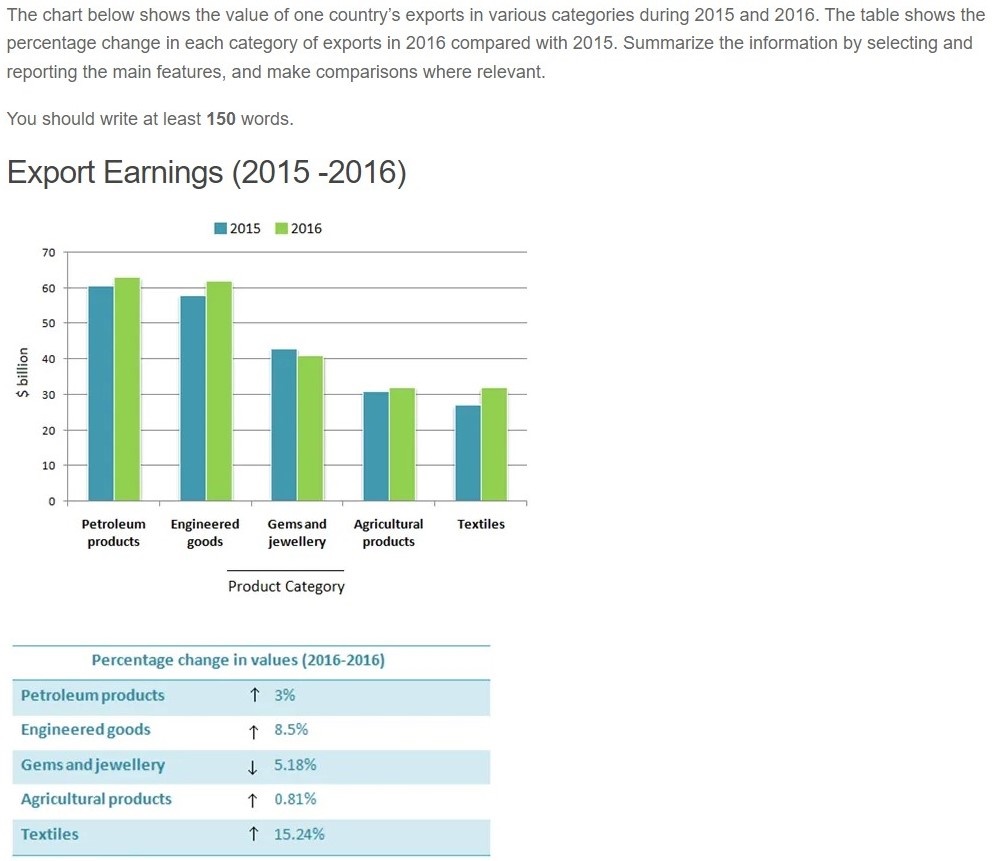
The bar chart represents the earning of one country (in billions) from export industries, and the table gives the percentage of value changes in each export categories in the year 2015 and 2016. Export industries were divided into 5 categories: petroleum products engineered goods, gems and jeweler, agricultural products and textiles.
Overall, in 2016, the export revenues from all of the industries increased except gem and jeweler. Moreover, textiles industry had the largest rise in the exports value, whilst agricultural products had the least.
The two main exports were for petroleum products and engineered goods, which the revenue for the former increased 3% in 2016 compares to 2015 (from approximately 61 billion dollars to 63 billion dollars), the latter rose 8.5% (from about 56 billion dollars to 61 billion dollars)
The figure for textiles and agricultural products stood at around 25 and 31 billions which inclined 15.24% and 0.81%, respectively, and reached to roughly 31 billion dollars. Finally, the income from gems and jewelry declined 5.18% to approximately 41 billion in 2016.
THX
Top answer
The bar chart represents the earnin g s of one country (in billions) from export s of five commodities: petroleum products engineered goods, gems and jewellery, agricultural products and textiles, industries, and the table gives the percentage of value c hanges in each export categories in between the yea r s 2015 and 2016. Export industries were divided into 5 categories: petroleum products engineered goods, gems and jeweler, agricultural products and textiles . Overall, in 2016, the export revenues from all of the industries categories increase d, except for gem s and jewel l er y .
- The bar chart represents the earnin g s of one country (in billions) from export s of five commodities: petroleum products engineered goods, gems and jewellery, agricultural products and textiles, industries, and the table gives the percentage of value c hanges in each export categories in between the yea r s 2015 and 2016.
- Export industries were divided into 5 categories: petroleum products engineered goods, gems and jeweler, agricultural products and textiles .
- Overall, in 2016, the export revenues from all of the industries categories increase d, except for gem s and jewel l er y .
- Moreover, textile s industry had the largest rise in the exports value, whilst agricultural products had the least.
- The two main exports were for p etroleum products and engineered good s.
Get the Weekly English Kit 📬
New words, one handy idiom, and a 2-minute quiz — delivered to your inbox to keep your streak alive.
The bar chart represents the earnings of one country (in billions) from exports of five commodities: petroleum products engineered goods, gems and jewellery, agricultural products and textiles, industries, and the table gives the percentage of value
 Related Questions