
Please review my ielts writing task 1
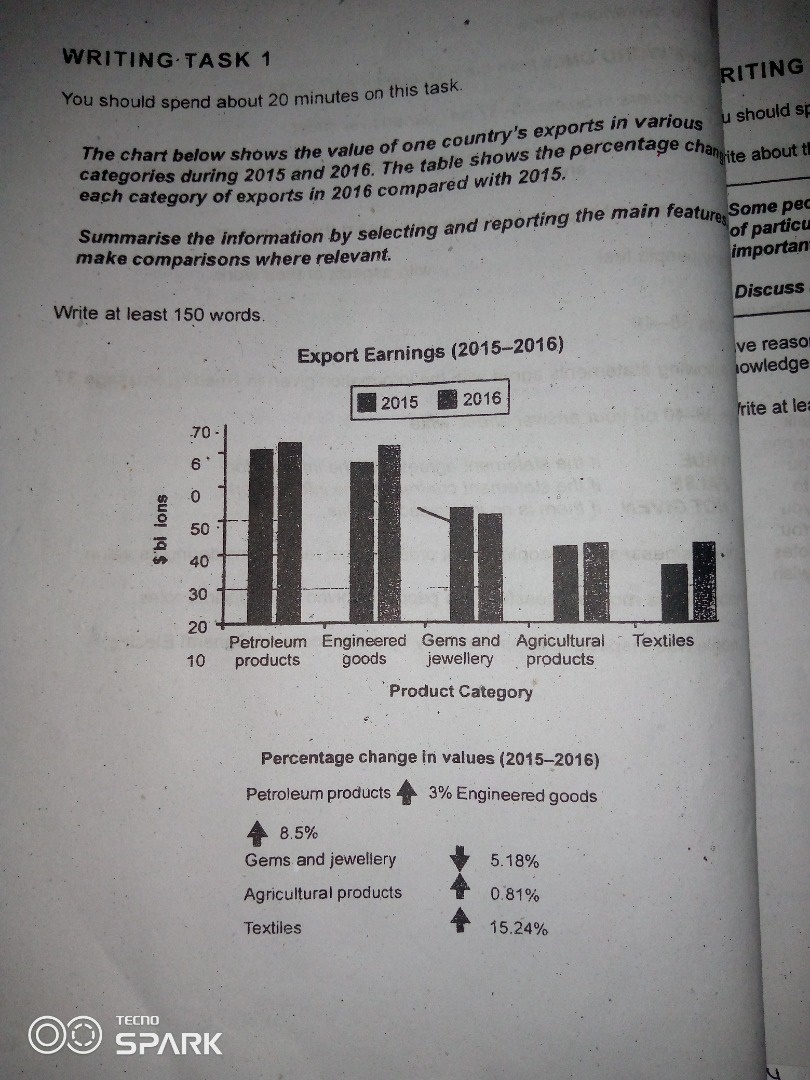
The given bar chart illustrates and compares the amount of money which earned by one country by exporting five distinct products in 2015 and 2016 and the tables provide the information about the change the took place between 2016 and 2015.
Overall, it can be seen that by exporting petrollium products the country earned the highest portion of money in 2015 whereas in that time textile was the lowest source of income and in the next year almost all the products saw an increase except gems and jewellery.
In 2015 ,around 60 million dollars was earned by exporting petroleum products which saw a relatively growth in the next year by 3%. The second highest amount of money earned in engineering materials which was approximately 57 billion dollars in 2015 and in the next year it rose by 8.5%. in case of agriculture and textile products the country earned between 35 and 40 million dollars in 2015 and it is noticeable that the figures levelled of at 42% in 2016. By selling James and jewellery products the country income about 52 million dollars but in the next year it saw a decrease by 5.18%.
WRITE DESCRIPTION HERE
Get the Weekly English Kit 📬
New words, one handy idiom, and a 2-minute quiz — delivered to your inbox to keep your streak alive.
 Related Questions