
Please Review My IELTS Writing Task 1
The pie charts below show information about where coffee is produced, consumed & where its profit goes.
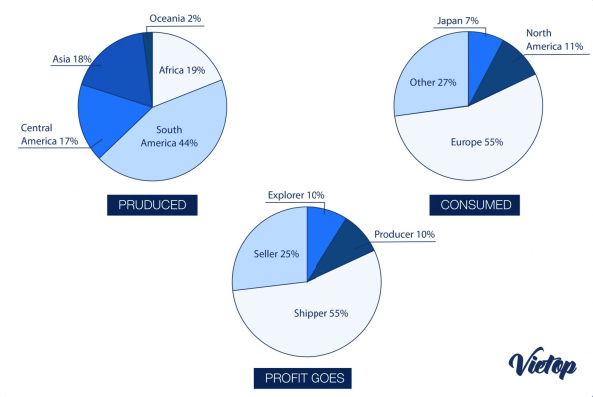
The given pie charts illustrate the production and consumption of coffee as well as its profit distribution.
Overall, it is clear that South America is the largest coffee producer, while Europe is the primary consumer of this product. In addition, the biggest profit from on coffee goes to shippers, while the opposite is true for explorers and producers.
In terms of production, the amount of coffee produced in South America makes up 44% of the total production, while the figure in Oceania comes last with only 2%. Central America, Asia, and Africa share nearly the same rates of coffee production, with 17%, 18%, and 19%, respectively.
Turning to coffee intake, the proportion of coffee consumption in Europe is 55%, which is relatively two times higher than that in other regions (27%). Japan and North America account for 7% and 11% of the global consumption, in turn. Regarding profit earnersMeanwhile, shippers make the most money, with 55% of the total profit compared to 25% of that for sellers. The percentages of profit shared by explorers and producers are equal (10%).
Top answer
Do you still need help with the above?
- Do you still need help with the above?
Get the Weekly English Kit 📬
New words, one handy idiom, and a 2-minute quiz — delivered to your inbox to keep your streak alive.
 Related Questions