
Please review my IELTS writing task 1
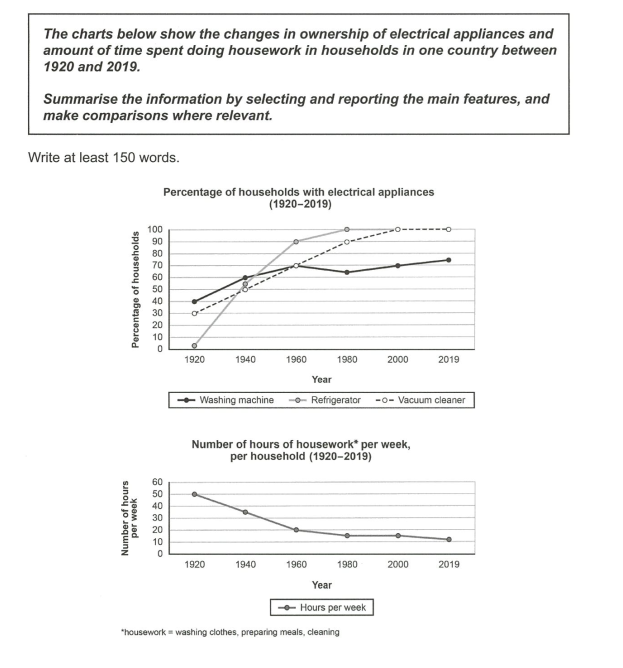
The line graphs give information about the percentage of electrical appliances owned and the time each family spent on housework in a particular country from 1920 to 2019.
In general, a large percentage of electrical devices were bought through the period shown while there was a downward trend can be seen in the household chores time.
In 1920, the proportion of families owned refrigerators was only about 4%, compared to the higher figure for vacuum cleaners and washing machines, at 30% and 40% respectively. In the next 40 years, the number of refrigerators went up nine times and reached 100% in 1980 then leveled off until 2019. In terms of the rest of the household appliances, there was a moderate increase in both devices. However, a slight drop was observed in the percentage of households with washing machines in 1980, the figure for vacuum cleaners still climbed to the maximum number at 100% and unchanged in the last 10 years.
Looking at the time for housework, in the first year each family took 50 hours per week to do household chores and the amount of time fell considerably (by 30 hours per week) in the following two decades, then went down marginally from that time to the end of the period, at just above 10 hours every week.
Top answer
The line graphs give information about (Vague. ) the percentage of electrical appliances (A percentage of an appliance does not make sense. ) owned and the time each family spent on housework in a particular country from 1920 to 2019.
- The line graphs give information about (Vague.
- ) the percentage of electrical appliances (A percentage of an appliance does not make sense.
- ) owned and the time each family spent on housework in a particular country from 1920 to 2019.
- In general, a large percentage of electrical devices were bought (That does not make sense.
- ) through the period shown while there was a downward trend can be seen in the household chores time .
Get the Weekly English Kit 📬
New words, one handy idiom, and a 2-minute quiz — delivered to your inbox to keep your streak alive.
The line graphs give information about (Vague. What is on the graph?) the percentage of electrical appliances (A percentage of an appliance does not make sense. What is half of a vacuum cleaner?) owned and the time each family spent on housework in a particular country from 1920 to 2019.
Sample essay
Paragraph #1: Describe the graphs completely. This sets the basis for cohesion and coherence through the essay.
The first line graph plots the percentage of homes which have a labor-saving household appliance in a particular country between 1920 and 2019. Data for three appliances are plotted, refrigerator, vacuum cleaner and washing machine. The second graph g
 Related Questions