
Please review my IELTS writing task 1
The graph below shows how elderly people in the United States spent their free time between 1980 and 2010. Summarise the information by selecting and reporting the main features, and make comparisons where relevant.
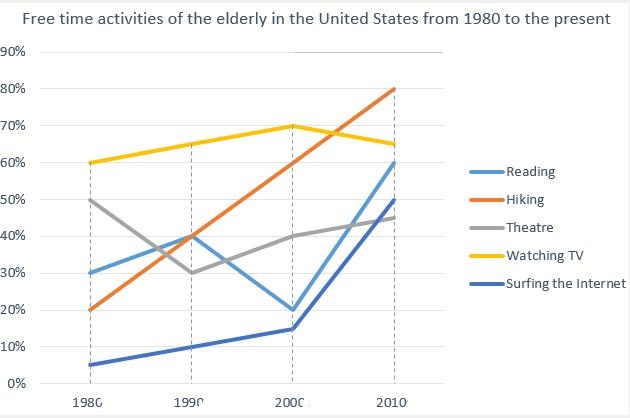
The multi-line graph plots the percentage of older Americans who did five different leisure activities between 1980 and 2010, namely hiking, theatre, reading, watching TV, and surfing the internet. Overall, each activity showed significant variations in popularity over the period. However, most of them attracted a higher proportion of seniors at the end, with the exception of theater-going.
Watching TV, reading, and going to the theater showed different trends within the timeframe. The percentage of TV watchers climbed from 60% in 1980 to 70% in 2000 before sliding back to approximately 65% in 2010, while that of theatergoers almost halved from 50% in 1980 to 30% in 1990 before rebounding to about 45% in 2010. More dramatic changes were recorded in the proportion of those reading, which climbed from 30% in 1980 to 40% in 1990 and then declined by half to 20% in 2000 before tripling to 60% in 2000.
By comparison, hiking and surfing the Internet grew in popularity alike. The percentage of hikers doubled from 20% in 1980 to 40% in 1990, equal to that of readers, and rose further to an all-time high of 80% in 2010, allowing hiking to replace watching TV as the favorite entertainment in approximately 2005. Similarly, the percentage of internet surfers soared nearly tenfold from about 5% in 1980 to 50% in 2010, making it no longer the least popular pastime in approximately 2008.
Get the Weekly English Kit 📬
New words, one handy idiom, and a 2-minute quiz — delivered to your inbox to keep your streak alive.
 Related Questions