
Please Review my IELTS Writing Task 1
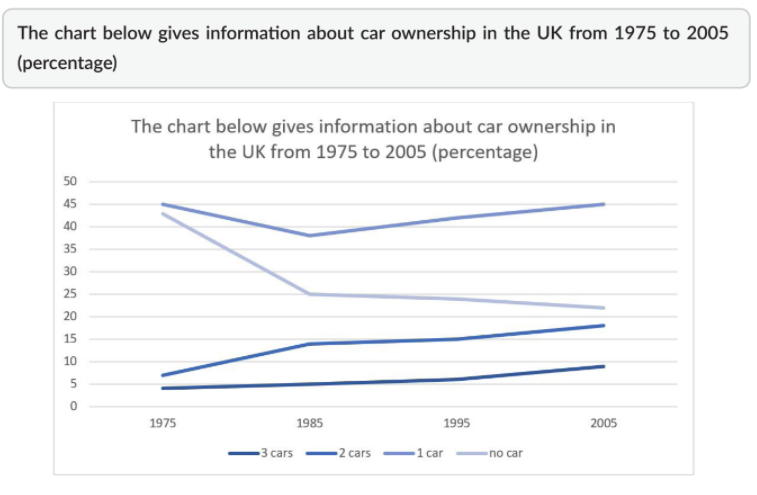
The line graph shows the percentage of owning how many cars in the UK between 1975 and 2005.
Overall, the relative proportion of having 3 cars, 2 cars and 1 car has an upward trend, whereas that of no car has a downward trend. The demand for 1 car ownership was the highest over the period shown.
In detail, in 1975, the total percentage of having cars in the UK accounted for about 57%, and it increased to 78% in 2005. Most of the rise can be attributed to the climb of the British’s demand for owning 2 cars and 3 cars. In 1975, the proportion of 2 cars and 3 cars ownership was about 7% and 5% respectively. The former went up to 18% and the latter grew to 10% in 2005. In 1985, having one car declined from 45% to 38%, but it still was the leader in car ownership in the UK. In 1975, the percentage of owning no car was about 43%, but it decreased substantially to 25% in 1985, then continued to fall steadily to 22% in 2005.
Top answer
hellen1605 he line graph shows the percentage of owning how many cars in the UK between 1975 and 2005. That is incorrect. Also, you did not have the correct task instructions, and that confused you.
- hellen1605 he line graph shows the percentage of owning how many cars in the UK between 1975 and 2005.
- That is incorrect.
- Also, you did not have the correct task instructions, and that confused you.
- The instructions did not tell you what the total basis is.
- The graph below gives information about car ownership per household in the UK from 1975 to 2005.
Get the Weekly English Kit 📬
New words, one handy idiom, and a 2-minute quiz — delivered to your inbox to keep your streak alive.
hellen1605he line graph shows the percentage of owning how many cars in the UK between 1975 and 2005.
That is incorrect.
Also, you did not have the correct task instructions, and that confused you. The instructions did not tell you what the total basis is.
The graph below gives information abo
 Related Questions