
Please Review My IELTS Writing Task 1
Topoic: The graph below shows the rate of smoking per 1000 people in Someland from 1960 to 2000.
Summarize the information by selecting and reporting the main features and make comparisons where relevant.
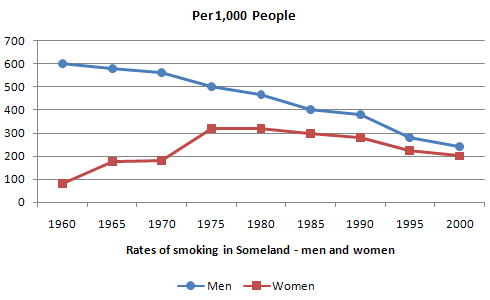
The line graph shows the smoking prevalence among men and women in Someland between 1960 and 2000. Units are measured in permillages.
Overall, smoking was more prevalent among men than women over the four decades. However, the difference in the proportions of men and women who lighted up cigerattes was in steady decline. They almost converged in 2000.
In 1960, there were 600 smokers for every 1000 men, six times as high as the number for women at 100 per 1000. Over the next 15 years, the proportion of male smokers declined by one sixth to 500 per 1000 in 1975, when that of female smokers more than trippled to 320 per 1000. Thereafter, the gender gap continued to narrow. The smoking rate among men fell by nearly half to approximately 250 per 1000 in 2000, while that among women slid back to 200 per 1000 at the end of the 40-year period.
Top answer
The line graph shows the smoking prevalence among men and women in Someland between 1960 and 2000. Units are measured in permillage s. (We measure data values, not units.
- The line graph shows the smoking prevalence among men and women in Someland between 1960 and 2000.
- Units are measured in permillage s.
- (We measure data values, not units.
- You can write "units are X" or "units of measure are X" "Permillage" is an exceedingly rare measurement unit.
- Most of the examiners will not know it.
Get the Weekly English Kit 📬
New words, one handy idiom, and a 2-minute quiz — delivered to your inbox to keep your streak alive.
The line graph shows the smoking prevalence among men and women in Someland between 1960 and 2000. Units are measured in permillages. (We measure data values, not units. You can write "units are X" or "units of measure are X" "Permillage" is an exceedingly rare measurement unit. Most of the examiners will not know it. However, if you use it in the opening paragraph, wr
 Related Questions