
Please review my IELTS writing task 1
Topic: the graph below shows the number of university graduates in Canada from 1992 to 2007. Summarise the information by selecting and reporting the main features and make comparisons where relevant.
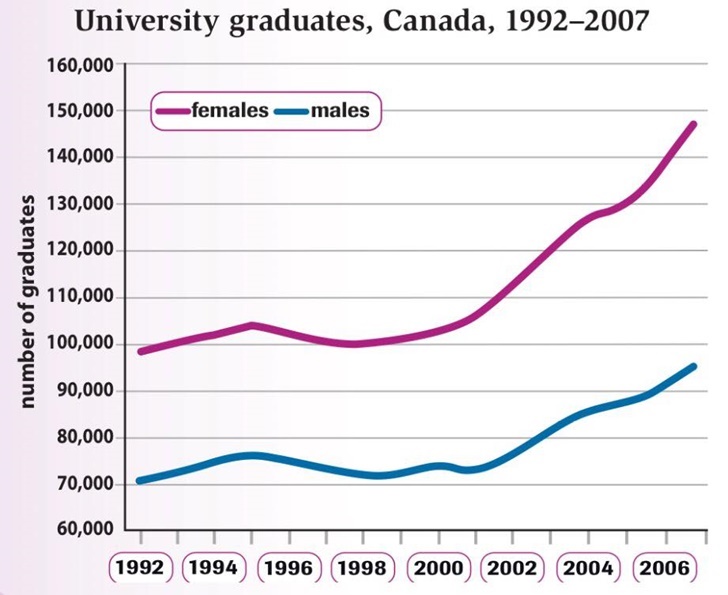
The line graph shows how many men and women graduated from university in Canada between 1992 and 2007.
Overall, there was a significant difference by gender, as female university graduates outnumbered males all the time. Nevertheless, they showed similar trends throughout the period. They were both on the increase in number in general, in spite of initial modest variations.
Slightly below 100,000 women finished university in 1992, a number which rose to about 105,000 in 1995 before dropping back to 100,000 in 1998. From the point onwards, it was in a constantly upward trend. As a result, it exceeded 110,000 in 2002, reached 130,000 in 2005 and finally hit a high of approximately 148,000 in 2007.
By comparison, there were around 70,000 male graduates in 1992. The number varied within a narrow band of 70,000 to 80,000 by 2003, when it reached approximately 82,000. Afterwards, it increased at a slow but steady pace, to around 95,000 in 2007.
Top answer
The line graph shows how many men and women graduated from university in Canada between 1992 and 2007. Overall, there was a significant gender difference by gender , as female university graduates outnumbered males all the time. Nevertheless, the y showed similar trends two curves were highly positively correlated throughout the period being relatively flat from 1992-2001, and then steadily increasing from 2001-2006 .
- The line graph shows how many men and women graduated from university in Canada between 1992 and 2007.
- Overall, there was a significant gender difference by gender , as female university graduates outnumbered males all the time.
- Nevertheless, the y showed similar trends two curves were highly positively correlated throughout the period being relatively flat from 1992-2001, and then steadily increasing from 2001-2006 .
- They were both on the increase in number in general, in spite of initial modest variations.
- Slightly below 100,000 women finished university in 1992, a number which rose to about 105,000 in 1995 before dropping back to 100,000 in 1998.
Get the Weekly English Kit 📬
New words, one handy idiom, and a 2-minute quiz — delivered to your inbox to keep your streak alive.
The line graph shows how many men and women graduated from university in Canada between 1992 and 2007.
Overall, there was a significant gender difference by gender, as female university graduates outnumbered males all the time. Nevertheless, they showed similar trends two curves were hig
Sample essay.
In Task1, it is important to combine categories and group similar things together if possible. Making comparisons is far better than just copying the numbers from the graph to your essay.
From the sample below, you can learn some math/science vocabulary and ways to group time periods, sum categories, and compute relative proportions and percentages. You just need to
 Related Questions