
Please review my IELTS Writing Task 1
The graph shows the percentage of UK adolescents following a vegetable diet.
Summarise the information by selecting and reporting the main features
The line graph gives information about the percentage of UK adolescents following a vegetable diet over the course of 60 years starting from 1960.
In general, there was a fluctuation in the percentage of UK teenagers being a vegetarian. At the end of the period, it was higher than the beginning.
In 1960, there was only a small percentage of UK young people interested in vegetarism, around 1%. From 1961 to 1980, the percentage rose significantly by 15%, from 2% to 17% and it reached its peak in 1980 with about 17%. Since 1980, the percentage dropped considerably, from 16% in 1980 to about 6% in 1993. Although the percentage of UK young people being a vegetarian had a slight increase in 1994 with 8% but it decreased by 4% in 1997. From 1997 to 2010, there had been a gradual rise, from 4% to over 10% before it almost stayed the same to 2020. 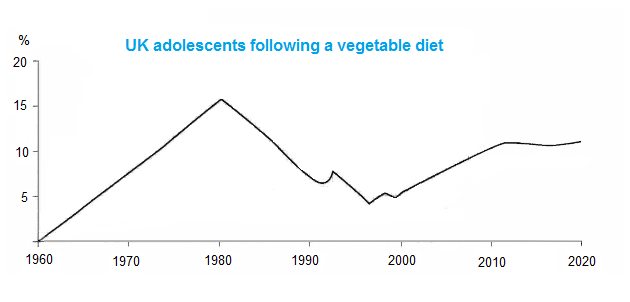
Top answer
) the percentage of UK adolescents following a vegetable diet over the course of 60 years starting from 1960. ) in the percentage of UK teenagers being a who were vegetarian. At the end of the period, it was higher than the beginning.
- ) the percentage of UK adolescents following a vegetable diet over the course of 60 years starting from 1960.
- ) in the percentage of UK teenagers being a who were vegetarian.
- At the end of the period, it was higher than the beginning.
- In 1960, there was only a small percentage of UK young people interested in vegetarism , (wrong spelling) around 1%.
- From 1961 to 1980, the percentage rose significantly by 15%, from 2% to 17% and it reached its peak in 1980 with about 17%.
Get the Weekly English Kit 📬
New words, one handy idiom, and a 2-minute quiz — delivered to your inbox to keep your streak alive.
The line graph gives information about (vague - write exactly what measure is plotted.) the percentage of UK adolescents following a vegetable diet over the course of 60 years starting from 1960.
In general, there was a fluctuation (wrong word - there is no pattern of fluctu
 Related Questions