
Please review my IELTS Writing Task 1
The charts below show local government expenditure in 2010 and 2015.
Summarise the information by selecting and reporting the main features, and make comparisons where relevant.
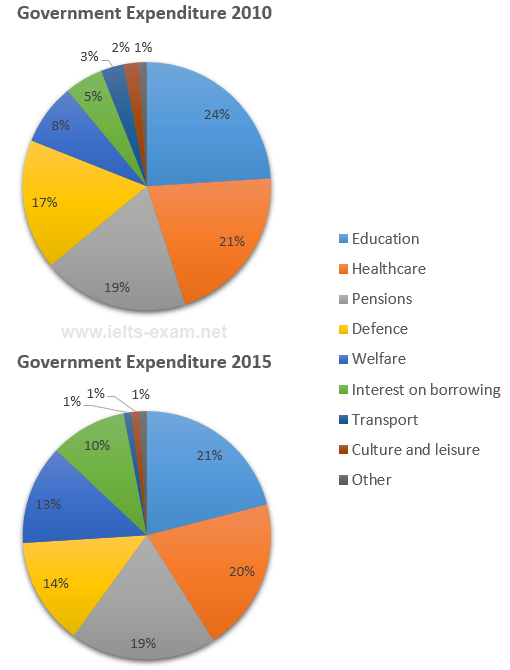
The pie charts compare the change of local government spending on nine fields for two different years (2010 and 2015).
Overall, the vast majority of the expenditure were education, healthcare, pensions and defence, whereas transport, culture and leisure and other aspects were expended least.
In 2010, education made up 24% of the expenditure and became the highest aspect that was expended by local government. Despite its decrease in 2015, it continued to be the major outlay with the percentage of 21%. This was followed by healthcare with 21% of expenditure but slightly decreased in 2015, at 20%. Interestingly, pensions remained unchanged with the percentage of 19%. For defence, there was a small decrease, from 17% in 2010 to 14% in 2015.
Additionally, welfare increased by 5%, going from 8% to 13%. There was a twofold increase in interest in borrowing, from 5% to 10%. In 2010, transport, culture and leisure and other expenditures were the smallest expenditures, 3%, 2%, 1% respectively. Five years later, transport, culture and leisure reduced to 1% each while other spending stayed the same.
Top answer
The pie charts compare the change of local government spending for nine budget categories fields for two different years (2010 and 2015). Overall, the vast majority of the expenditure were was in education, healthcare, pensions and defence, whereas transport, culture and leisure and miscellaneous items other aspects were the expended least. In 2010, education made up 24% of the budget expenditure and was the largest single category.
- The pie charts compare the change of local government spending for nine budget categories fields for two different years (2010 and 2015).
- Overall, the vast majority of the expenditure were was in education, healthcare, pensions and defence, whereas transport, culture and leisure and miscellaneous items other aspects were the expended least.
- In 2010, education made up 24% of the budget expenditure and was the largest single category.
- became the highest aspect that was expended by local government.
- Despite its decrease in 2015, it continued to be the major outlay with the percentage of 21%.
Get the Weekly English Kit 📬
New words, one handy idiom, and a 2-minute quiz — delivered to your inbox to keep your streak alive.
The pie charts compare the change of local government spending for nine budget categories fields for two different years (2010 and 2015).
Overall, the vast majority of the expenditure
 Related Questions