
Please Review My IELTS Writing Task 1
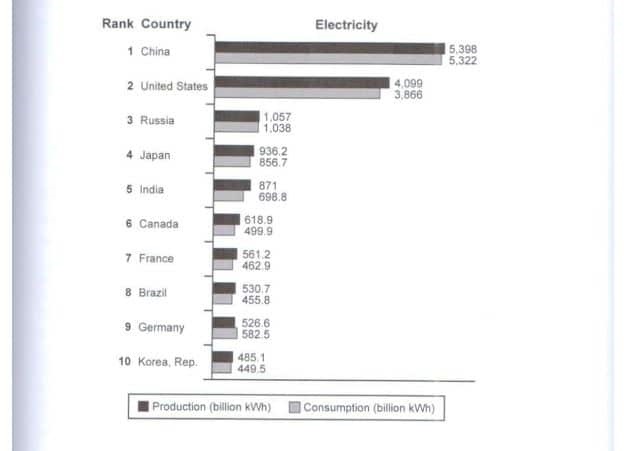
Task 1: The bar chart below shows the top ten countries for the production and consumption of electricity in 2014.
Summarise the information by selecting and reporting the main features and make comparisons where relevant.
The bar chart illustrates the amounts of electricity produced and consumed by the top ten countries in 2014.
It is clear that out of the ten nations, the electricity consumption and production of China and the US were far higher than in the other nations. It is also noticeable that Germany is the only country that consumed more electricity than it generated.
Out of the ten nations, China is at the top of electricity production and consumption with being more than 5.300 billion kWh each, followed by the US in second-largest with consumer-generated 4.099 billion kWh and consumed 3.866 billion kWh.
In terms of the remaining countries, it can see Russia is the only country with electricity production and consumption of just over 1.000 billion kWh, followed by Japan and India, with slightly lower numbers, ranging from 698.6 to 1.057 billion kWh. The figures for other countries show the difference in electricity production and consumption at around 50-150 billion kWh, while interestingly Germany produced 526.6 billion kWh of electricity but consumed 582.5 billion kWh.
Top answer
The bar chart illustrates (poor word choice) the amounts of electricity produced and consumed by the top ten countries in 2014. It is clear that out (That is "filler" text. ) Of the ten nations, the electricity consumption and production of China and the US were far higher than in the other nations.
- The bar chart illustrates (poor word choice) the amounts of electricity produced and consumed by the top ten countries in 2014.
- It is clear that out (That is "filler" text.
- ) Of the ten nations, the electricity consumption and production of China and the US were far higher than in the other nations.
- It is also noticeable that (Avoid these dummy-it clauses.
- ) Germany is the only country that consumed more electricity than it generated.
Get the Weekly English Kit 📬
New words, one handy idiom, and a 2-minute quiz — delivered to your inbox to keep your streak alive.
The bar chart illustrates (poor word choice) the amounts of electricity produced and consumed by the top ten countries in 2014.
It is clear that out (That is "filler" text. It has no information content.) Of the ten nations, the electricity consumption and production of China and the US were far higher than in the ot
 Related Questions