
Please Review My IELTS Writing Task 1
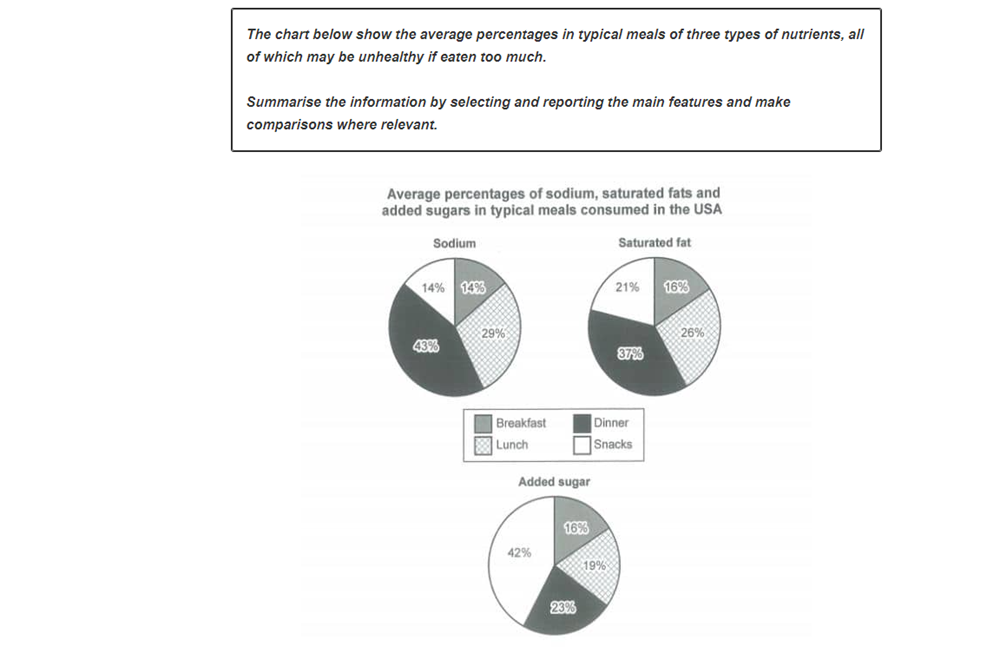
The pie charts compare the average consumption of three nutrients in four meals, the overconsumption of which can cause some health problems.
Overall, it can be clear sodium and saturated fat are rich in foods at dinner, while added sugar is mostly from the snacks. In addition, breakfast is the fewest nutrients, which is revealed by the smallest pie on all charts.
In terms of sodium and saturated fat, both nutrients are mostly provided in the evening meals, at 43 percent and 37 percent respectively. Moreover, at lunch of both always followed dinner with 29 percent and 26 percent. Additionally, an equal proportion of sodium is contained in snacks and breakfast with 14 percent each, while the percentage of saturated fat is contained in snacks and breakfast, with 21 percent and 16 percent respectively.
Regarding chart added sugar, more than 40 percent of the nutrient is from the snacks and followed closely by at dinner just 23 percent. The added sugar values at lunch are significantly lower, with 19 percent and breakfast is not dense in added sugar only 16 percent.
Top answer
The pie charts (How many? ) compare the average consumption of three nutrients in four meals , (that makes no sense. ) the overconsumption of which (the meals?
- The pie charts (How many?
- ) compare the average consumption of three nutrients in four meals , (that makes no sense.
- ) the overconsumption of which (the meals?
- ) can cause some health problems.
- ) sodium and saturated fat are rich in foods at dinner, while added sugar is mostly from the snacks.
Get the Weekly English Kit 📬
New words, one handy idiom, and a 2-minute quiz — delivered to your inbox to keep your streak alive.
The pie charts (How many? and what is in each chart?) compare the average consumption of three nutrients in four meals, (that makes no sense. ) the overconsumption of which (the meals? ) can cause some health problems.
Overall,
 Related Questions