
Please review my IELTS writing task 1
The graph below shows UK rain emissions, measure in million of tonnes, from four different sectors between 1990 and 2007
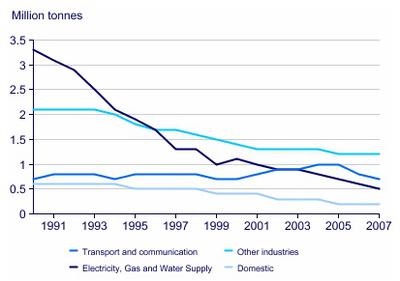
The line graph illustrates the amount of rain gases released in UK from four different categories from 1990 to 2007
Overall, there was a downward trend in UK rain emissions from electricity, gas and water supply, domestic and other industries. While the amount of emissions from transport and communication tend to increase.
In 1990, around 3.3 million tonnes of gases produced from electricity, gas and water supply, compared to 0.75 million tonnes from transport and communication. After declined dramatically over the next 9 years, emissions from electricity, gas and water supply sector reached its lowest point at approximately 0.5 million tonnes in 2007. Whereas, the amount of gases from transport and communication leveled off until peaked at 1 million tonnes in 2005
Acid rain emissions from other two categories decreased over the period shown. Domestic was responsible for 0.6 million tonnes of gases in 1990, while other industries released 2 million tonnes. Gases from both domestic and other industries fell gradually to 0.2 million tonnes and 1.25 million tonnes respectively in 2007
Top answer
There is a problem with the topic. Rain is water that falls from clouds. Countries do not emit rain.
- There is a problem with the topic.
- Rain is water that falls from clouds.
- Countries do not emit rain.
- Please check the topic and your essay and post a correction.
Get the Weekly English Kit 📬
New words, one handy idiom, and a 2-minute quiz — delivered to your inbox to keep your streak alive.
 Related Questions