
Please review my IELTS writing task 1
The graph below shows relative price changes for fresh fruits and vegetables, sugars and sweets, and carbonated drinks between 1978 and 2009.
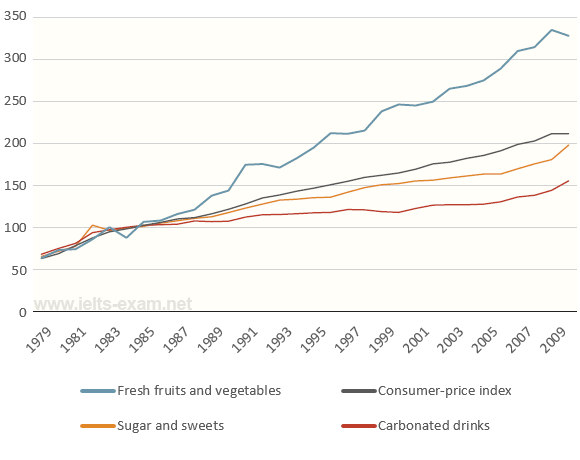
The line graph gives information about changes in price of three different types of food and beverage: fresh fruits and vegetables, sugars and sweets, and carbonated drinks from 1979 to 2009. It also shows the overall trend in consumer-price index over a thirteen-year period. In general, there was an increase in four lines during 30 years
Over the period, both price changes for sugar and sweets, and consumer-price index witnessed a similar trend. In 1979, these two lines had the same starting figure at approximately 60 percent, followed by a steady increase to 100 percent in 1984. Thereafter, price changes in sugar and sweets rose steeply to 200 percent in 2009, compared to 210 percent in consumer-price index. After remaining the same from 1988 to 2002, price of soft drinks reached its highest point at roughly 150 percent in the final year
It is clear that there was a considerable rise in fresh fruits and vegetables price changes. It started at nearly 60 percent in 1979, then fluctuated dramatically until peaking at 330 percent in 2009.
Top answer
The line graph gives information about (vague. Non-specific. ) changes in price the prices of three different types of food and beverage s: fresh fruits and vegetables, sugars and sweets, and carbonated drinks from 1979 to 2009.
- The line graph gives information about (vague.
- Non-specific.
- ) changes in price the prices of three different types of food and beverage s: fresh fruits and vegetables, sugars and sweets, and carbonated drinks from 1979 to 2009.
- It also shows the overall trend in the consumer-price index (CPI).
- over a thirteen-year period (Incorrect.
Get the Weekly English Kit 📬
New words, one handy idiom, and a 2-minute quiz — delivered to your inbox to keep your streak alive.
The line graph gives information about (vague. Non-specific. See my previous comment.) relative (Relative is very important.) changes in price the prices of three different types of food and beverage
 Related Questions