
Please review my IELTS writing task 1
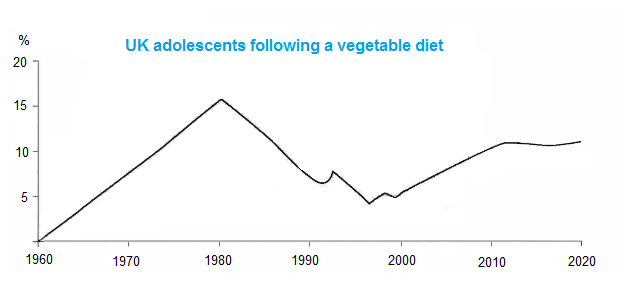
The graph shows the percentage of UK adolescents following a vegetarian diet
The line graph gives information about the proportion of youngsters who choose to follow vegetarianism in the UK from 1960 to 2020
Overall, the graph shows two main periods of adolescents who interested in vegetarianism: the plant-based eating tendency was most popular in the first twenty years, and the downward trend in forty years later
There was an upward trend from 1960 to 1980. In 1960, only a small young people were vegetarians (about 1%). Thereafter, it increased dramatically until reached its highest point at 17%, followed by a steep fall to approximately 6% in 1991
The number of young people eating vegetables tend to decline in the second period. There was a fluctuation until 2000. Over the following ten years, the percentage of young vegetarians rose moderately from nearly 5% to 11%. Then it expected to remain the same in the next nine years.
Top answer
" Information about" could be the average height, the age ranges, ethnicity, gender, and other parameters. When you describe a graph, tell the reader exactly what is plotted. ) the proportion of youngsters (Wrong word.
- " Information about" could be the average height, the age ranges, ethnicity, gender, and other parameters.
- When you describe a graph, tell the reader exactly what is plotted.
- ) the proportion of youngsters (Wrong word.
- Youngsters in the US are aged about 7-12.
- ) Overall, the graph shows two main periods of adolescents (wrong phrase.
Get the Weekly English Kit 📬
New words, one handy idiom, and a 2-minute quiz — delivered to your inbox to keep your streak alive.
The line graph gives information about ("information about" is very vague and non-specific." Information about" could be the average height, the age ranges, ethnicity, gender, and other parameters. When you describe a graph, tell the reader exactly what is plotted. ) the proportion of youngster
 Related Questions