
Please review my IELTS WRITING TASK 1
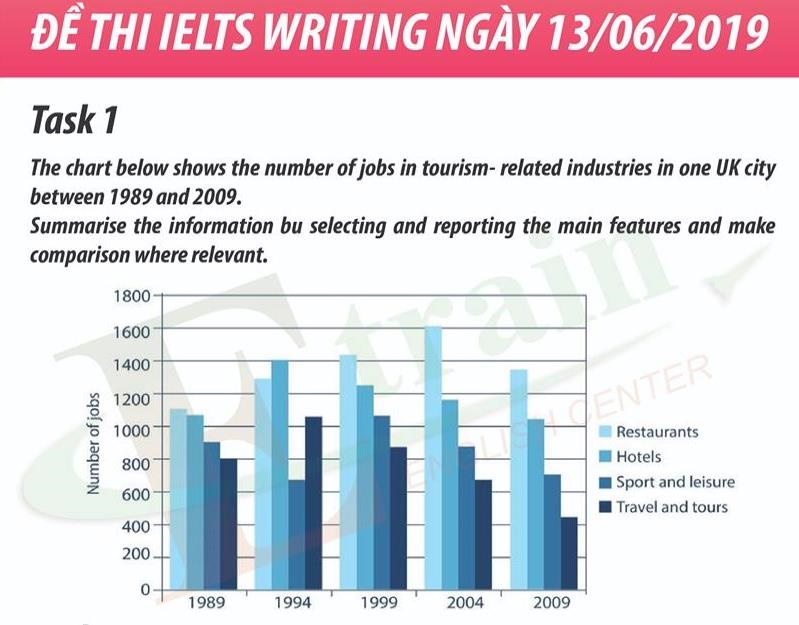
The bar chart represents changes in number of occupations in tourism sectors in one city of the UK from 1989 to 2009. Overall, it is clear from the chart that restaurants and hotels were the most popular jobs, whereas sport and travel were chosen the least over the period.
In 1989, the number of job in restaurants stood at the highest of 4 industries, around 1100. Between 1994 and 2004, this figure increased considerably from 1300 to 1600, but after there was a significant decrease in 2009, approximately 1300. Similarly, hotels were also the second common option. Although the number of hotels was higher than restaurants in 1994, this number jumped to over 1000 in the end.
In contrast, the jobs in sport activities and tourism had some fluctuation over a 20 year period. Although the year 1999 witnessed a considerable increase in sport and leisure, there was plunged in 2009 from over 1000 to 700. Likewise, travel and tours were not a common choice, which stood at 400 at the end of the period.
Top answer
You did not read my advice that I gave you in your last post. If you don't learn from my corrections, they are useless for you. Please read my advice on Task 1.
- You did not read my advice that I gave you in your last post.
- If you don't learn from my corrections, they are useless for you.
- Please read my advice on Task 1.
- You make all the usual mistakes.
- IELTS TASK 1: Hints, Tips And Advice The bar chart represents (wrong word - show, depict, present) changes in number of occupations (wrong word - an occupation is a type of job, not an individual job) in tourism sectors (wrong word ) in one city of the UK from 1989 to 2009.
Get the Weekly English Kit 📬
New words, one handy idiom, and a 2-minute quiz — delivered to your inbox to keep your streak alive.
You did not read my advice that I gave you in your last post. If you don't learn from my corrections, they are useless for you.
Please read my advice on Task 1. You make all the usual mistakes.
IELTS TASK 1: Hints, Tips And Advice
The bar chart
 Related Questions