
Please review my IELTS writing task 1
The graph gives information about drinking habits of the US population by age.
Summarise the information by selecting and reporting the main features, and make comparisons where relevant.
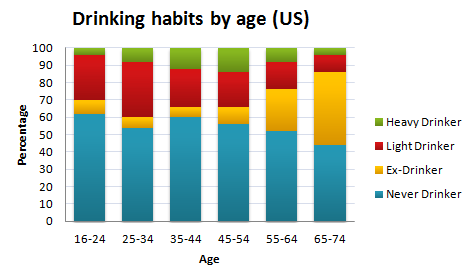
The bar chart presents the percentages of drinking patterns of US citizens among different age groups ranging from 16 to 74.
Overall, a large proportion of young and middle-aged Americans are non-drinkers and light drinkers, and this proportion becomes smaller in the old age groups, whereas the opposite is true of ex-drinkers.
Those who never drink make up the largest percentage among young and middle-aged Americans, around over 50%. This percentage, however, accounts for less than half in the old age group 65-74. Similarly, the proportion of those who drink lightly is the second largest, around a quarter, among young and middle ages but accounts for only around a tenth among senior citizens aged over 55.
In contrast, the percentage of those who quit drinking is relatively small in the young and middle age groups which is averagely less than 10%, nevertheless, it constitutes approximately 40% of the old population. Meanwhile, heavy drinkers make up a disproportionately small fraction among the youngest 16-24, and the oldest 65-74, about 2%, and account for a larger segment in the middle age groups 35-54, about than 10%.
Top answer
) age groups ranging from 16 to 74. ( The first paragraph is incomplete. What are the categories?
- ) age groups ranging from 16 to 74.
- ( The first paragraph is incomplete.
- What are the categories?
- What are the age groups?
- ) Overall, a large proportion of young and middle-aged Americans are non-drinkers and light drinkers, and this proportion becomes smaller in the old er age groups, whereas the opposite is true of ex-drinkers.
Get the Weekly English Kit 📬
New words, one handy idiom, and a 2-minute quiz — delivered to your inbox to keep your streak alive.
The bar chart presents the percentages of drinking patterns of US citizens by their regular consumption of alcoholic beverages among different (How many?) age groups ranging from 16 to 74. ( The first paragraph is incomplete. What are the categories? What are the age groups? )
 Related Questions