
Please review my IELTS writing task 1
Hello,
This is the first time I work with multiple charts in writing task 1. Please take your time to review this for me.
Thank you very much!
The following is my essay:
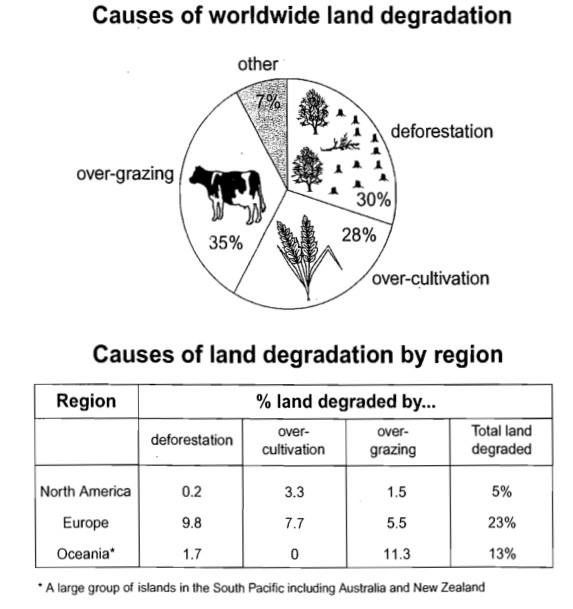
The pie chart illustrates the proportions of causes of land degradation in the world, and the table compares the percentage of land that affected by these causes in three regions named Europe, North America and Oceania in the 1990s.
Overall, overgrazing affected land degradation the most, followed by other factors including deforestation, over-cultivation and other. According to the table, Europe had the largest proportion of degraded land compared to North America and Oceania. Also, the land which was degraded by deforestation accounted for the highest percentage in Europe, while those of North America and Oceania were over-cultivation and overgrazing respectively.
Looking at the pie chart, overgrazing was the largest cause of land degradation, with 35% compared to the 30% caused by deforestation, 28% resulted from over-cultivation and 7% from other causes.
According to the table, Europe had the largest percentage of degraded land, with 23%, which nearly doubled that of Oceania and was as 4.6 times as that of North America. In North America, 3.3% of land degraded by over-cultivation, which was much higher than those of overgrazing and deforestation, with only 1.5% and 0.2% respectively. Meanwhile, the percentage of land degraded by over-cultivation was 7.7% in Europe. It was lower than that of deforestation (9.8%) and higher than that of overgrazing (5.5%). Finally, the land degraded by overgrazing accounted for the highest and almost total degraded land in Oceania, with 11.3%, that of deforestation accounted for only 1.7%, and no land degraded by over-cultivation.
Top answer
The pie chart illustrates the proportions of causes (incorrect. ) of land degradation in the world, and the table compares the percentage of land that affected (wrong grammar) by these causes in three regions , namely named Europe, North America and Oceania in the 1990s. Overall, overgrazing affected land degradation (Incorrect description.
- The pie chart illustrates the proportions of causes (incorrect.
- ) of land degradation in the world, and the table compares the percentage of land that affected (wrong grammar) by these causes in three regions , namely named Europe, North America and Oceania in the 1990s.
- Overall, overgrazing affected land degradation (Incorrect description.
- It did not affect degradation, it affected the land badly, so that the land became degraded.
- ) the most, followed by other factors including deforestation, over-cultivation and other.
Get the Weekly English Kit 📬
New words, one handy idiom, and a 2-minute quiz — delivered to your inbox to keep your streak alive.
The pie chart illustrates the proportions of causes (incorrect. it show proportions of degraded land, not proportion of causes.) of land degradation in the world, and the table compares the percentage of land that affected (wrong grammar) by these causes in three regions
 Related Questions