
Please review my IELTS writing part 1
My essay:
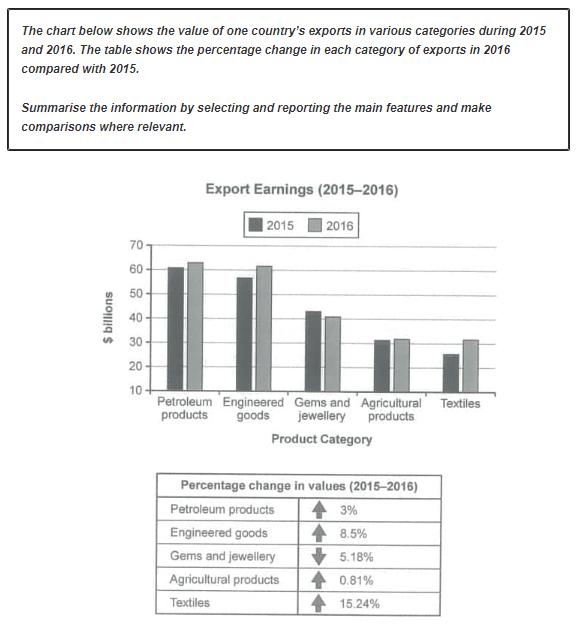
The bar chart depicts a country's exportation value in five categories (petroleum products, engineered goods, gems, and jewelry, agricultural products, and textiles) in 2015 and 2016. In addition, the table below the graph represents the percentage change in the values of those categories.
Overall, the two categories that had the highest values in 2015 and 2016 are petroleum products and engineered goods, approximately $60 billion in values. In contrast, agricultural products and textiles had the lowest percentages of all 5 categories, just fluctuated around $40 billion. Although there are big differences in values between the major export income and the minor, there are some slight changes from 2015 to 2016.
In detail, petroleum products, and engineered goods had the highest proportions in 2015 and also in 2016. There was a slight change (3%) in the petroleum category, but there was a greater change in engineered goods, at 8.5%. Textile was the least valuable category in 2015; however, there were the biggest change of 5 categories in textile, went from just below 40% to more than that. Agricultural products had the smallest, infinitesimal percentage change, 0.81%. Gems and jewelry had stayed in the middle of the 5 categories, drop modestly just about 5%.
Get the Weekly English Kit 📬
New words, one handy idiom, and a 2-minute quiz — delivered to your inbox to keep your streak alive.
 Related Questions