
Please review my IELTS writing part 1
There figure consists of three bar charts represent the consumption of three types of nutrients (sodium, saturated fat, added sugar) in snack, breakfast, lunch, and dinner. All of those ingredients may be unhealthy if they are eaten too much. All of the information is gathered particularly in the US.
Overall, dinner had the highest percentages if we sum up all the information. Then came after that is the snack. Next, the three unhealthy nutrients are consumed less in lunch, but the least nutrients were consumed in breakfast.
In detail, the type of meals that have highest amount of those nutrients is dinner, 43% in Sodium, and 37% in Saturated fat. Although there are just 23% of Added sugar came from dinner, dinner still contributed lots of sodium, saturated fat, and added sugar. Lunch contributed a decent amount of sodium (29%) and saturated fat (26%). It also created a small amount of added sugar, but overall it came third, just before breakfast. Breakfast created the least amounts of those three nutrients, relatively 14% of sodium came from breakfast, 16% of saturated fat, and the same percentage from added sugar. Snack is an exponential line if we lay the information on a graph line, increased from 14% sodium to 42% in added sugar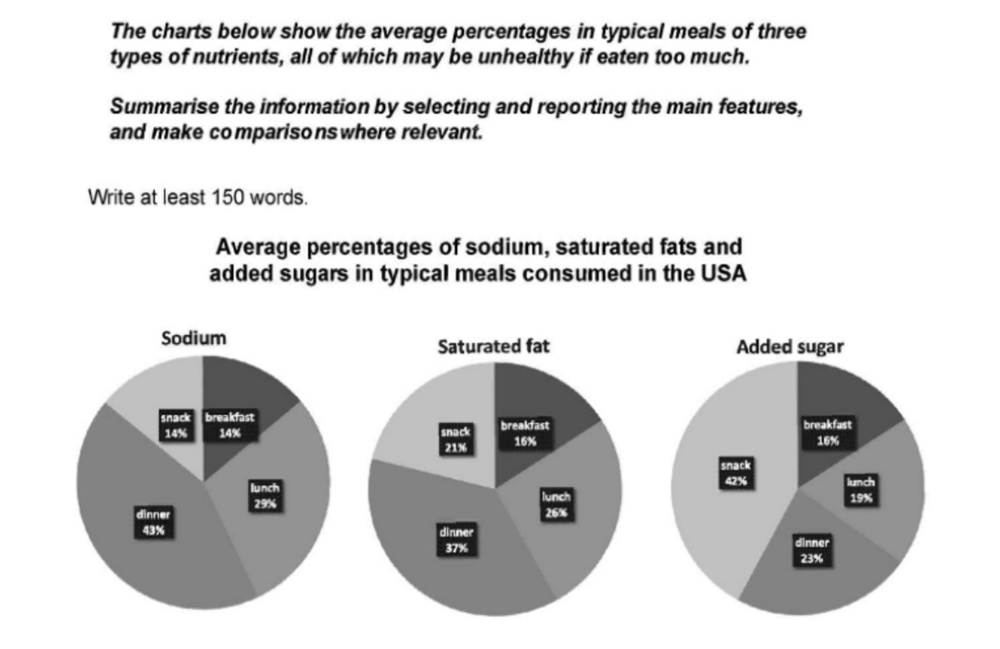
before that is 21% in lunch.
Get the Weekly English Kit 📬
New words, one handy idiom, and a 2-minute quiz — delivered to your inbox to keep your streak alive.
 Related Questions