
Please review my IELTS writing part 1
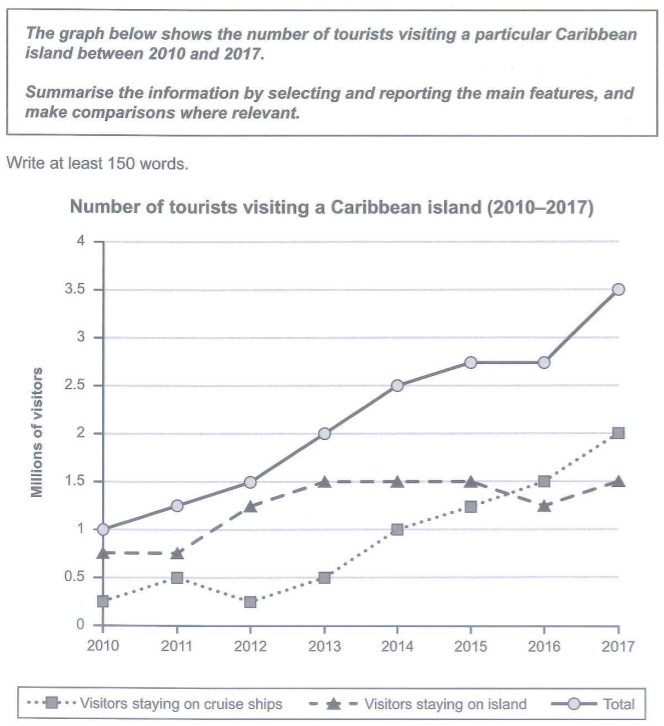
The graph depicts how many visitors came to a specific Caribbean island in the span of 7 years, from 2010 to 2017.
Overall, the graph contains more lines which go up more than go down. Therefore, it creates a positive correlation between the number of visitors and the years from 2010 to 2017. The graph that shows the total number of tourists is nearly linear.
In detail, visitors who stayed on cruise ships increase gradually from 2010 to 2017 though there is a slight drop in 2012. In 2010, the travelers who stayed on cruises are about 250.000 people, but there are 2 million people did that in 2017. Next, the number of visitors staying on the island started higher than the who stayed on cruises. But there are just some minute increases from 2010 to 2013, and from then the number of tourists just stayed steadily (1.5 million people), even had a minor drop in 2016, when the number of visitors staying on cruise surpassed the numbers of those staying on the island. Finally, the total numbers of visitors to this island increase immensely through 7 years, from just about 1 million people to 3.5 million people.
Top answer
) depicts how many visitors came to a specific Caribbean island in the span of 7 years, from 2010 to 2017. (Incomplete. There are three curves on this graph.
- ) depicts how many visitors came to a specific Caribbean island in the span of 7 years, from 2010 to 2017.
- (Incomplete.
- There are three curves on this graph.
- You need to tell the reader about the three curves in the first paragraph.
- ) Overall, the graph contains more lines which go up more than go down.
Get the Weekly English Kit 📬
New words, one handy idiom, and a 2-minute quiz — delivered to your inbox to keep your streak alive.
The graph (What kind of graph?) depicts how many visitors came to a specific Caribbean island in the span of 7 years, from 2010 to 2017. (Incomplete. There are three curves on this graph. You need to tell the reader about the three curves in the first paragraph. Otherwise, they will be confused when they read the rest of your essa
 Related Questions