
Please review my Ielts writing.
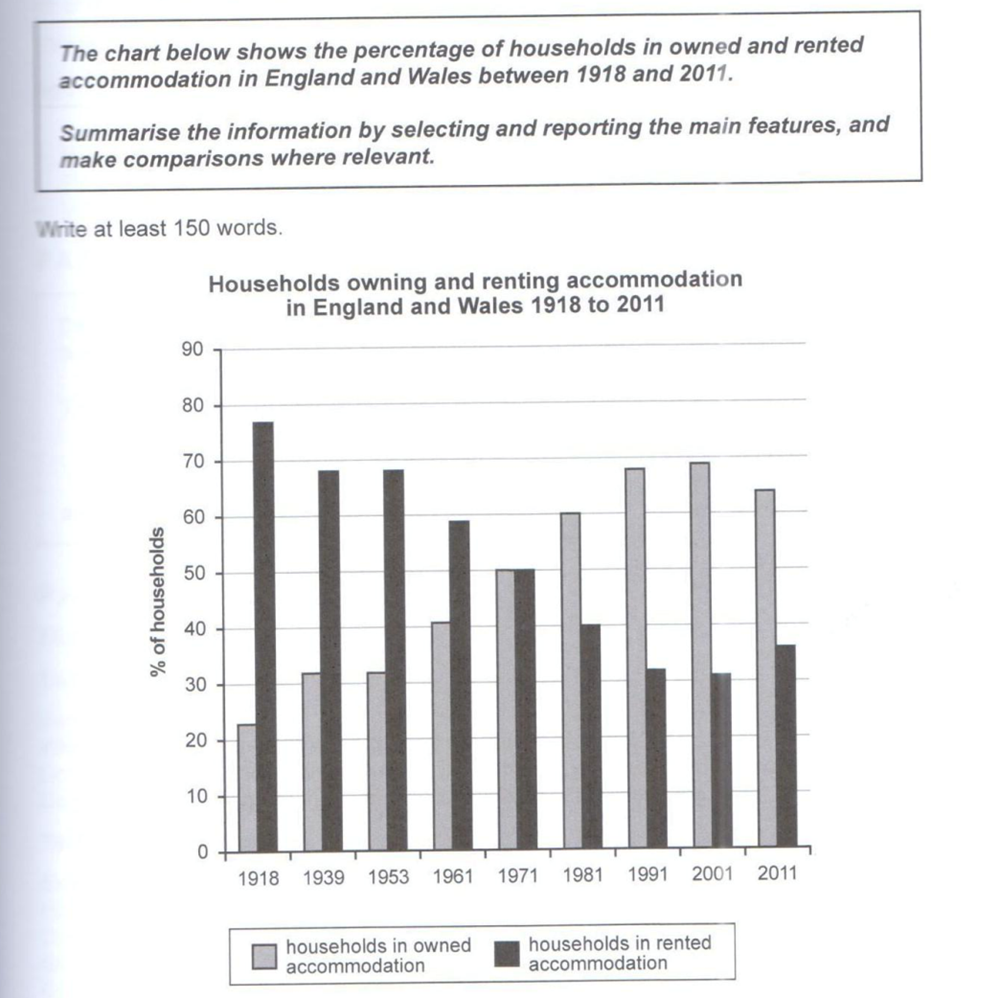
The bar chart given compares the proportion of home ownership and houses for rent in two countries namely England and Wales over a period of 93 years.
It is clear that the percentage of owned and rented households in 1971 were exactly the same, at 50%. While the proportion of rented accommodation showed an upward tendency over the period shown, the figures for owned accommodation illustrated a different pattern.
In 1918, the percentage of houses for rent accounted for the highest percentage of total renting accommodation , which tripled the proportion of households owning. Between 1939 and 1953, the proportion of rental housing was about 70%, which was approximately 40% higher than that of home ownership.
From 1961 to 2001, the percentage of rental housing declined to 32%. By contrast, the proportion of owned accommodation witnessed a rapid increase, which also took the lead of the total percentage of home ownership. In 2011, the proportion of home ownership and rental housing did not increase or decrease too much.
Top answer
The bar chart given compares the proportion of home ownership and that of households renting [ 1 ] houses for rent in [ 2 ] two countries namely England and Wales over a period of 93 years (1918-2011) . [ 3 ] It is clear that Overall, t he percentage of owned and rented households in 1971 were exactly the same, at 50%. w hile the proportion of rented accommodation showed [ ] an upward a downward tendency over the period shown, the figures for owned accommodation increased .
- The bar chart given compares the proportion of home ownership and that of households renting [ 1 ] houses for rent in [ 2 ] two countries namely England and Wales over a period of 93 years (1918-2011) .
- [ 3 ] It is clear that Overall, t he percentage of owned and rented households in 1971 were exactly the same, at 50%.
- w hile the proportion of rented accommodation showed [ ] an upward a downward tendency over the period shown, the figures for owned accommodation increased .
- illustrated a different pattern .
- Moreover, [ 4 ] the percentages of owned and rented households in 1971 were exactly the same, at 50%.
Get the Weekly English Kit 📬
New words, one handy idiom, and a 2-minute quiz — delivered to your inbox to keep your streak alive.
The bar chart given compares the proportion of home ownership and that of households renting [ 1] houses for rent in [ 2] two countries namely England and Wales over a period of 93 years (1918-2011).
[ 3] It is clear that
 Related Questions