
PLEASE REVIEW MY IELTS WRITING
Topic: The chart below shows the results of a survey about people’s coffee and tea buying and drinking habits in five Australian cities.
The bar 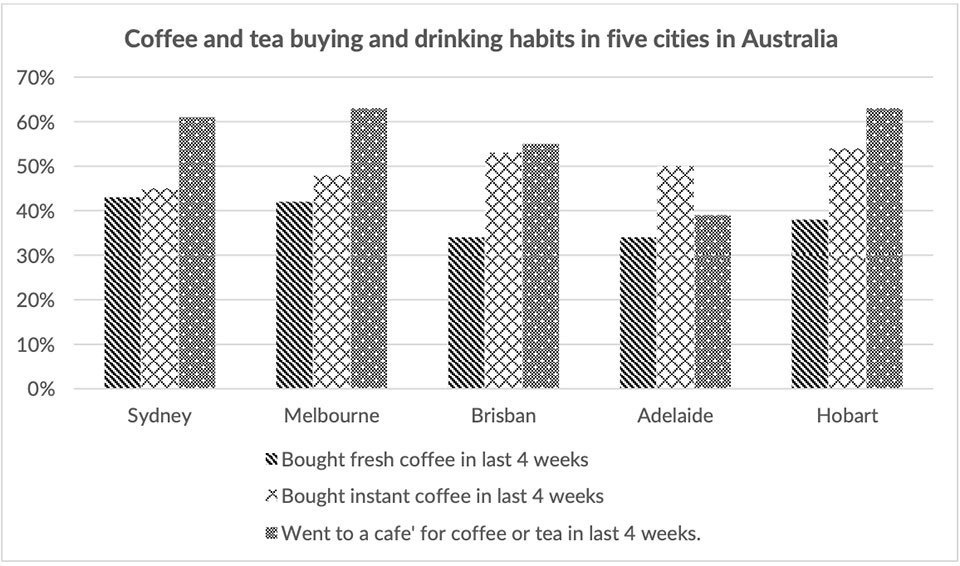
illustrates the outcome of a questionnaire about the habitual usage of coffee and tea among consumers in five different cities in Australia.
Overall, it can be seen that the percentage of citizens consuming habits fluctuated during the whole period. Meanwhile, the most striking feature of the chart is that people going to a coffee shop to enjoy coffee or tea, by contrast, that people purchasing fresh coffee remained the lowest number.
As can be seen from the chart, the proportion of Sydney residents going to a cafe to enjoy coffee or tea accounted for the highest number, over 60%, while the respondents to the survey prefered to buy fresh coffee reached the peak with nearly 45%. In Melbourne and Hobart, the figures for people enjoying coffee at a coffee shop experienced the highest, nearly 65%. Meanwhile, somewhat two fifth of buyers use natural coffee. However, a tiny number of citizens making a purchase for fresh coffee could be seen in Brisbane and Adelaide, making up just more than a third, while that people going to a cafe occupied 55% and 50% respectively.
Stocking up on instant coffee was below 55% for all cities. The purchase was most common in Hobart, stood at 54%, followed by Brisbane at 52%. In Sydney, more than two fifths of residents had a habit of buying instant coffee. Finally, a close similarity can be seen in the percentage of people choosing to buy instant coffee in Melbourne and Adelaide, at around 50%.
Top answer
The bar chart illustrates the outcome results of a questionnaire about the consumption of habitual usage of coffee and tea among consumers in five different cities in Australia over a 4-week period . Overall, having tea or coffee in a cafe was the most popular alternative in all cities apart from Adelaide, in which consumers preferred to buy instant coffee instead. [ 1] it can be seen that the percentage of citizens consuming habits fluctuated during the whole period.
- The bar chart illustrates the outcome results of a questionnaire about the consumption of habitual usage of coffee and tea among consumers in five different cities in Australia over a 4-week period .
- Overall, having tea or coffee in a cafe was the most popular alternative in all cities apart from Adelaide, in which consumers preferred to buy instant coffee instead.
- [ 1] it can be seen that the percentage of citizens consuming habits fluctuated during the whole period.
- Meanwhile, the most striking feature of the chart is that people going to a coffee shop to enjoy coffee or tea, B y contrast, that people purchasing fresh coffee remained was the lowest in all five cities.
- number.
Get the Weekly English Kit 📬
New words, one handy idiom, and a 2-minute quiz — delivered to your inbox to keep your streak alive.
The bar chart illustrates the outcome results of a questionnaire about the consumption of habitual usage of coffee and tea among consumers in five different cities in Australia over a 4-week period
 Related Questions