
Please review my IELTS task 1 essay. Thank you!
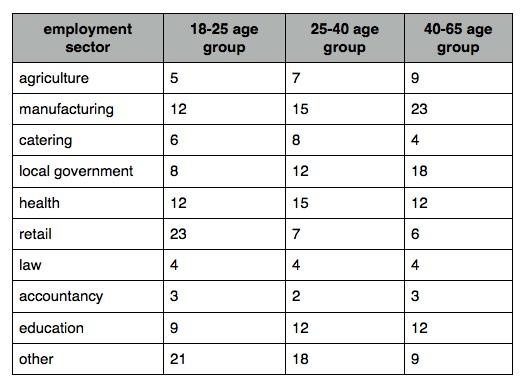
The table below gives information about the employment sectors in which people from 3 age groups work.
---------------------------------------------------------------------------------------------------------------------
My essay:
The table compares the number of employees which are separated into three age groups: 18-25 (young adults), 25-40 (adults), and 40-65 (mid-aged) between nine different employment sectors and other, measured in individuals.
Overall, accountancy has the fewest people of all age groups working. Furthermore, young adults work more like retailers, at 23 people, whereas more middle-aged people are working in the manufacturing field (at 23 compared to 12 of the youngest age group and 15 of the second oldest one). On the other hand, the highest number of workers between 25 to 40 employ in other fields, at 18.
There is an equal number of employees from three age groups who work in the law sector, at 4 each. Moreover, the older the age group is, the more individuals work for agriculture, manufacturing, local government, and education, while retail and other sectors are in the opposite trend.
Adults work more in the catering sector, at 8 in comparison to 6 (young adults), and 4 (mid-aged). In the health field, there is an equal number of people between the youngest and oldest age groups, at 12, but there is a gap between group aged 18-25 and 25-65, at 9 compared to 12 in education one.
Top answer
Do not use this practice exam. It is flawed.
- Do not use this practice exam.
- It is flawed.
Get the Weekly English Kit 📬
New words, one handy idiom, and a 2-minute quiz — delivered to your inbox to keep your streak alive.
 Related Questions