
Please review my IELTS task 1 essay. Thank you!
WRITING TASK 1
You should spend about 20 minutes on this task.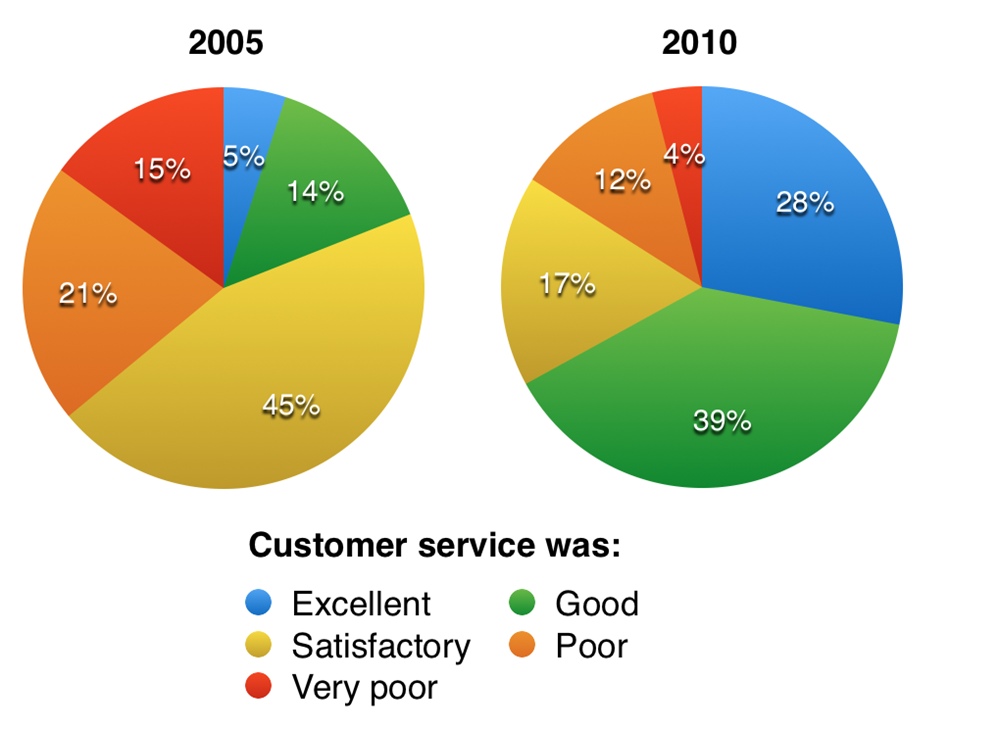
Write at least 150 words.
The charts below show the results of a questionnaire that asked visitors to the Parkway Hotel how they rated the hotel's customer service. The same questionnaire was given to 100 guests in the years 2005 and 2010.
Summarise the information by selecting and reporting the main features and make comparisons where relevant.
------------------------------------------------------------------------------------------
My essay:
The pie charts compare the percentage of 100 people rating the Parkway Hotel's customer service in five categories: excellent, good, satisfactory, poor, and very poor between 2005 and 2010.
Overall, in 2005, the number of visitors rated satisfactory was the largest share among other ratings, whereas, in 2010, the shares of good and excellent categories took place to be the largest and second-largest.
In 2005, 45 guests satisfied with the Parkway Hotel service, which was twice as many as the second-ranked rating, poor customer service, at 21. The number of people who rated very poor and good was nearly the same, stood at 15% and 14% respectively. However, just 5% of the customers felt this hotel's service excellent.
In 2010, the number of people rating excellent and good service surpassed those satisfied, at 28% and 39% respectively compared to 17%. Furthermore, the percentage of visitors who didn't like their service decreased significantly, with 12 guests thought poor and just 4 rated very poor.
Thank you!!!
Top answer
The pie charts compare the percentage levels of satisfaction (five grades from excellent to poor) with customer service of 100 pe ople rating at the Parkway Hotel 's customer service in five categories: excellent, good, satisfactory, poor, and very poor between based on a survey of one hundred guests carried out in 2005 and 2010. Overall, in 2005, [ 1] the percentage of those who gave a better than “satisfactory” ra t ing increased substantially from 19% to 67% over that five-year period. By the same token, the percentage of dissatisfied patrons declined notably from 36% to 16%.
- The pie charts compare the percentage levels of satisfaction (five grades from excellent to poor) with customer service of 100 pe ople rating at the Parkway Hotel 's customer service in five categories: excellent, good, satisfactory, poor, and very poor between based on a survey of one hundred guests carried out in 2005 and 2010.
- Overall, in 2005, [ 1] the percentage of those who gave a better than “satisfactory” ra t ing increased substantially from 19% to 67% over that five-year period.
- By the same token, the percentage of dissatisfied patrons declined notably from 36% to 16%.
- number of visitors rated satisfactory was the largest share among other ratings, whereas, in 2010, the shares of good and excellent categories took place to be the largest and second-largest.
- In 2005, [ 2] 45 guests satisfied with the Parkway Hotel service, which was twice as many as the second-ranked rating, poor customer service, at 21 .
Get the Weekly English Kit 📬
New words, one handy idiom, and a 2-minute quiz — delivered to your inbox to keep your streak alive.
The pie charts compare the percentage levels of satisfaction (five grades from excellent to poor) with customer service of 100 people rating at the Parkway Hotel 's customer service in f
 Related Questions