
Please review my IELTS task 1
The bar graph shows the global sales (in billions of dollars) of different types of digital games between 2000 and 2006. Write a report for a university, lecturer describing the information shown below.
Summarise the information by selecting and reporting the main features and make comparisons where relevant. You should write at least 150 words.
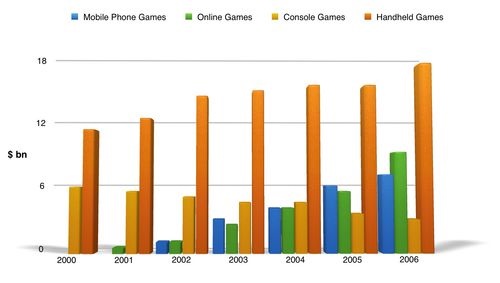
The given graph depicts the information of various types of digital games in global sales which is in billion of dollars from the period 2000 to 2006
Overall, there are mainly four types of games namely mobile phone, online, console and handheld games. Handheld games continued to have the most sales throughout the period. Although sales for moblie phone and online games came into use at a later stage but has shown a steady increase where as console games reached a bottom.
In detail, global sales for handheld games started around 11 billion in 2002 and reached their highest level in 2006 nearly to 18 billion where as Sales of console games showed a steady decline from 6 billion to around 3 billion in 2006. Online games though introduced first, sales for mobile phone games and online games remained same in 2002 at 1 billion, but it rose upto 7 billion and 9 billion respectively by the end of the period.
Top answer
Please read my advice for Task 1 essays: IELTS TASK 1: Hints, Tips And Advice Vocabulary Words For Task 1: Reference Post
- Please read my advice for Task 1 essays: IELTS TASK 1: Hints, Tips And Advice Vocabulary Words For Task 1: Reference Post
Get the Weekly English Kit 📬
New words, one handy idiom, and a 2-minute quiz — delivered to your inbox to keep your streak alive.
The given ("given or "provided" is not natural English. Delete. What kind of graph is this?) graph depicts the information ( "Information" is very very vague. Information of games might be the number of players, or what level - child or adult - it is for. Or how popular it is. Be specific. What does it depict? What is plotted?
Sample essay (~180 words)
The bar graph compares the sales (in billions of dollars) of four categories of electronic games (mobile phone, online, console and handheld) from 2000 through 2006.
Overall, total revenues went up significantly over these seven years. Handhelds had the largest sales by a wide margin. The only type whose sales declined was console games.
In detail,
 Related Questions