
Please review my IELTS task 1
The graph below shows UK acid rain emissions, measured in millions of tones, from four different sectors between 1990 and 2007.
The line graph illustrates the volume of acid rain emissions in the UK made by four sectors from 1990 to 2007.
It is noticeable that the total amount of acid rain emissions decreased rapidly over the 17-year period. Overall, the most significant decline was seen in electricity, gas and water supply.
In 1991, around 3.5 million tons of acid rain emissions came from electricity, gas and water supply. While the volume if emissions made by transport and communication was approximate 0.7 million, the figure for domestic was slightly lower, at above 0.5 million. There was 2.1 million tons of emission procedure by other industries in this year.
Emissions from electricity, gas and water supply dropped dramatically, stood at around 0.5 million in 2007. At the same time, while the highest percentage was recorded in 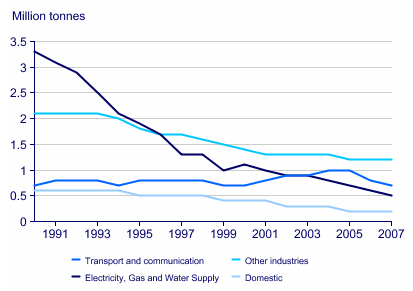
other industries, at nearly 1.5 million, the figures for transport and communication and domestic was 0.7 and around 0.2 million respectively.
Top answer
Please post essays in the essay forum:
- Please post essays in the essay forum:
Get the Weekly English Kit 📬
New words, one handy idiom, and a 2-minute quiz — delivered to your inbox to keep your streak alive.
The line graph illustrates shows the volume amount of acid rain emissions in the UK made by four sectors from 1990 to 2007.
(Note: Volume is measured in cubic meters, amount or weight is measured in tonnes. The graph does not show volumes in cubic meters. )
It is noti
 Related Questions