
Please review my IELTS report - Line Graph.
Question:- The graph below shows the household recycling rates there different countries between 2005 and 2015.
My answer:-
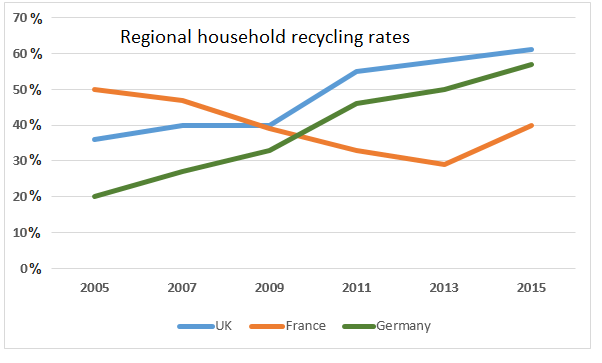
The line graph illustrates the regional household recycling rates in the Uk, France, and Germany from 2005 to 2015.
Overall, the recycling rates of the Uk and Germany showed a significant rise over the period, while the percentage of France recycled waste experienced a downward trend.
In 2005 the recycling rates of the Uk, and Germany were nearly 35% and a fifth respectively. Germany rates increased sharply throughout the period, and exceeding France's ratio in 2009, and reaching almost half (50%) in the end of the period. In the meantime, the per centum of recycled waste in the Uk grew to its two-fifth in 2007, and remained steady from 2009 to 2011. It experienced a rapid surge more than 50% and continued with a gradual increased to 60% in 2015.
In early 2005 the recycling rate of France's (almost half) was the highest among these three countries. However, it dramatically declined to 30% in 2013. Then, there was a growth of one-in-ten percent in 2015, but still France;s recycling rates was the lowest in the end of the period.
Top answer
The line graph illustrates the regional household recycling rates in the U K , France, and Germany from 2005 to 2015. Overall, the recycling rates of the U K and Germany showed a significant rise over the period, while the percentage that of France recycled waste experienced a downward trend for most of it but recovered towards the end . In 2005 the recycling rates of the Uk, UK and Germany were nearly 35% and a fifth 20% respectively.
- The line graph illustrates the regional household recycling rates in the U K , France, and Germany from 2005 to 2015.
- Overall, the recycling rates of the U K and Germany showed a significant rise over the period, while the percentage that of France recycled waste experienced a downward trend for most of it but recovered towards the end .
- In 2005 the recycling rates of the Uk, UK and Germany were nearly 35% and a fifth 20% respectively.
- The graphs for those two countries were almost parallel to each other and both rose significantly throughout that period, especially between 2009 and 2011, but the UK’s rate was always higher than Germany’s, with the former ending the period at just above 60% and the latter trailing closely behind at approximately 55%.
- Germany rates increased sharply throughout the period, and exceeding France's ratio in 2009, and reaching almost half (50%) in the end of the period.
Get the Weekly English Kit 📬
New words, one handy idiom, and a 2-minute quiz — delivered to your inbox to keep your streak alive.
The line graph illustrates the regional household recycling rates in the UK, France, and Germany from 2005 to 2015.
Overall, the recycling rates of the UK and Germany showed a significant rise over the period, while the percentage that of Fra
 Related Questions