
Please Review My IELTS Essay_Task 1
Here is my essay
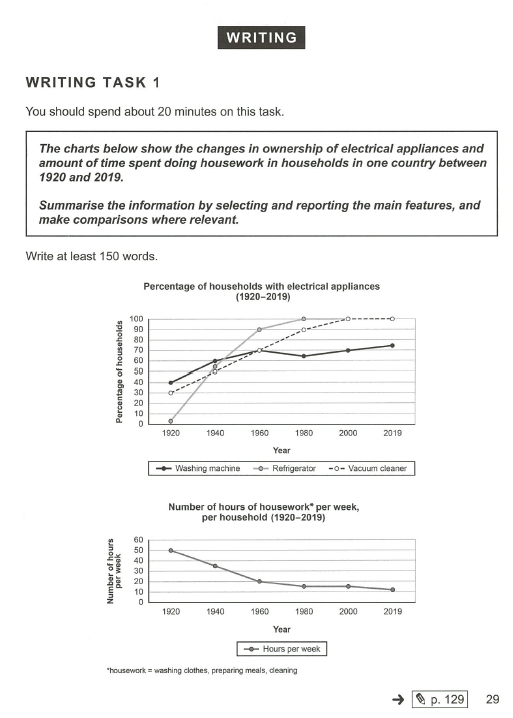
The chart illustrate the percentage of households with electrical appliances, which are washing machine, refrigerator, and vacuum cleaner from the year 1920 to 2019 and the number of hours of housework per week, per household during that period.
Overall, from 1920 to 2019, the percentage of households with electrical appliances were on an upward trend while the number of hours of housework per week, per household was on a downward trend.
Since 1920 to 1960, the percentage of households using washing machines and vacuum cleaners increased to the same amount of 70 percent in 1960 , that of refrigerator steeply grew up with 90 percent in the same year. Meanwhile, the number of hours of housework per week, per household dropped dramatically, from 50 percent to 20 percent.
The percentage of households using refrigerators climbed to 100 percent and then kept stable until 2019, that of vacuum cleaners also went up before remaining steady from 2000 to 2019, that of washing machines reduced slightly from 1980 to 200, but then it rose moderately to 75 percent in 2019. Whereas, the number of hours of hose work per week, per household kept declined to 10 hours.
Many thanks in advance.
Top answer
Please read my advice for Task 1 essays: IELTS TASK 1: Hints, Tips And Advice Vocabulary Words For Task 1: Reference Post
- Please read my advice for Task 1 essays: IELTS TASK 1: Hints, Tips And Advice Vocabulary Words For Task 1: Reference Post
Get the Weekly English Kit 📬
New words, one handy idiom, and a 2-minute quiz — delivered to your inbox to keep your streak alive.
The chart (wrong word. These are not charts, and there is more than one.) illustrate (very poor word choice Read my advice. . ) the percentage of households with electrical appliances, which are washing machine, (wrong form.) refrigerator
 Related Questions