
Please review my IELTS essay(4)
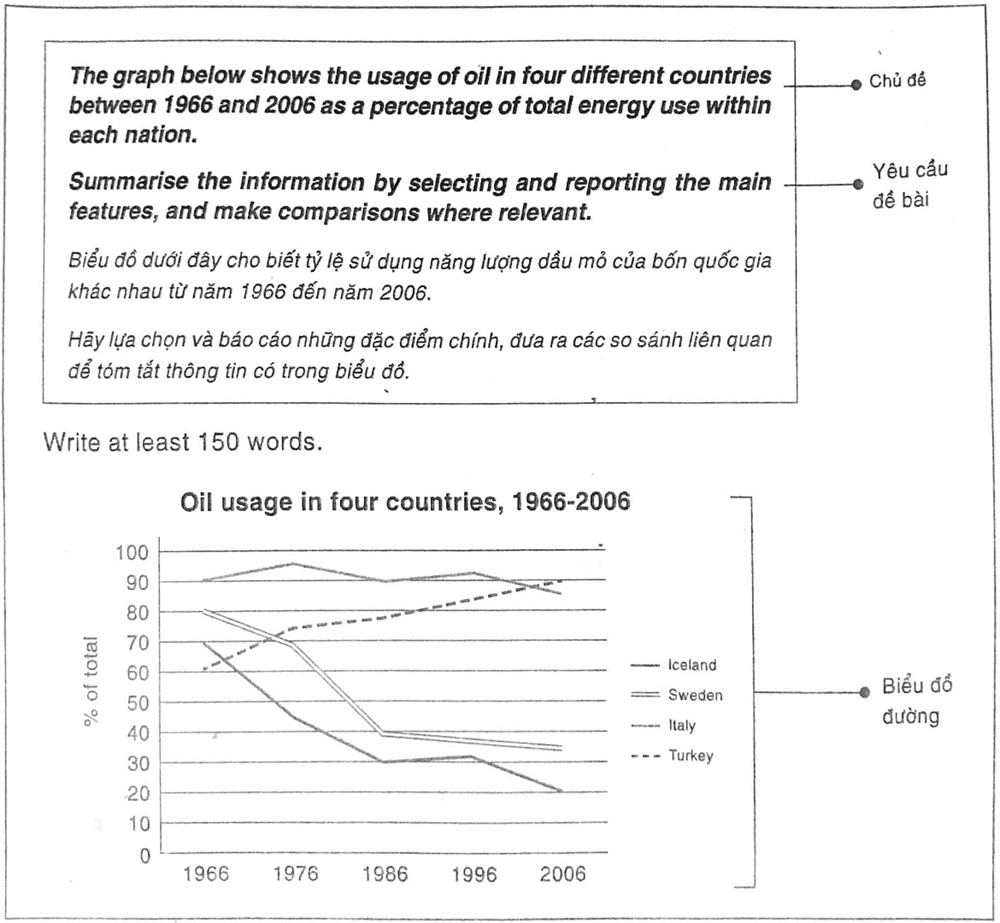
The line graph presents the percent of the total energy used in Iceland, Sweden, Italy and Turkey between 1966 and 2006.
Overall, the proportion of Sweden, Iceland had a downtrend while that of Turkey had an uptrend. Besides, Italy went up and down in different periods and rose in general.
In 1966, Italy's percentages of the oil used were the highest at 90 percent. In 1976 it had the first-highest peak at about 95 percent and reverted to 90 percent in 1986. Then, in 1996 it had the second-highest peak at about 93 percent and decreased more than before at around 85 percent in 2006. Even so, Italy was still higher than the others. Besides, Sweden significantly rose from 80 percent in 1966 to approximately 70 percent in 1976 and plummeted remarkably at about 40 percent in 1986. In the next 20 years, Sweden fell steadily about 35 percent in 2006.
In contrast, the percentage of Turkey that was the shortest rose rapidly from 60 percent in 1966 to around 75 percent in 1976 and decreased steadily in the next 30 years, Detaily, its proportion approximately 80 percent in 1986, about 85 percent in 1996 and in 2006 it creased by the intimate of Italy was 90 percent was the four times Iceland, about three times Sweden.
Get the Weekly English Kit 📬
New words, one handy idiom, and a 2-minute quiz — delivered to your inbox to keep your streak alive.
 Related Questions