
Please review my IELTS essay(3)
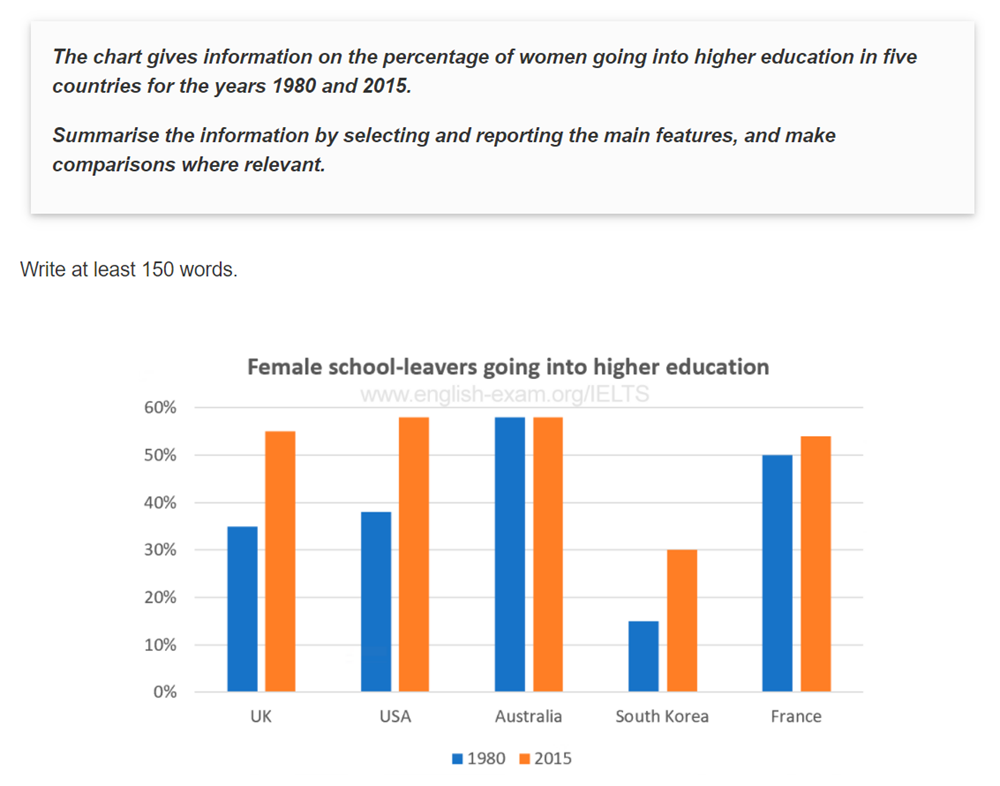
The bar chart shows the proportion of female school-leavers going into higher education in the UK, the US, Australia, South Korea, and France in 1980 and 2015.
Overall, the UK, the USA, South Korea, and France had various changes from 1980 to 2015 but Australia. Australia was the best stable when it did not change over 35 years which the highest in 1980 and 2015, while the others had an upward trend.
Especially, in 1980 Australia was the highest with about 60 percent, it is four times that of South Korea which was the shortest in five countries with approximately 15 percent. Australia was followed by France 50 percent. The USA was shorter than France with around 40 percent, closely was the UK with 35%. In 2015 Australia was stable, while the others significantly increased. The USA went up peer with Australia by about 60 percent. Besides, the UK also had a growth rate same the USA, it significantly increased from about 35 percent to 55 percent. France had a growth rate is the shortest with 50 percent to approximately 52%. Although South Korea had the proportion in the chart is the shortest, its growth rate was higher than France, South Korea went up double over 35 years from about 15 percent in 1980 to 30 percent in 2015.
Top answer
The bar chart shows the proportion of female school-leavers going into higher education in the UK, the US, Australia, South Korea, and France in 1980 and 2015. Note: They are called high school graduates in the US. Overall, the UK, the USA, South Korea, and France had various changes (That is not a "main feature" ) from 1980 to 2015 but Australia .
- The bar chart shows the proportion of female school-leavers going into higher education in the UK, the US, Australia, South Korea, and France in 1980 and 2015.
- Note: They are called high school graduates in the US.
- Overall, the UK, the USA, South Korea, and France had various changes (That is not a "main feature" ) from 1980 to 2015 but Australia .
- ) when it did not change over 35 years (You cannot make this conclusion.
- How do you know that it did not change in 1990, 1i86, 1998, 2001 or 2003?
Get the Weekly English Kit 📬
New words, one handy idiom, and a 2-minute quiz — delivered to your inbox to keep your streak alive.
The bar chart shows the proportion of female school-leavers going into higher education in the UK, the US, Australia, South Korea, and France in 1980 and 2015.
Note: They are called high school graduates in the US.
Overall, the UK, the USA, South Korea, and France had various changes (That is not a "main feature" ) f
 Related Questions