
Please review my IELTS essay WT1
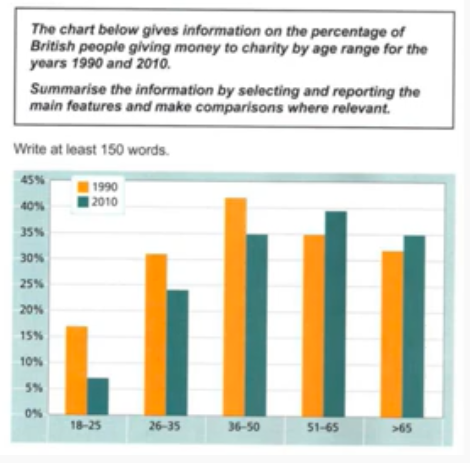
The bar chart shows the proportion of British people who give money to charity in five age groups in 1990 and 2010.
Overall, it is clear that the percentage of people between 36 and 50 giving money to charity was the highest. The percentage of people donating money in 1990 was greater than in 2010. It is also noticeable that the most difference in the proportion of people donating money in two years was in a group of people from 18 to 25.
In 1990, more than 40% of British people between 36 and 50 gave money to charity, it is the highest proportion in the chart, while the least proportion was in a group of people from 18 to 25. In 2010, these figures of both groups decreased to 35% and 14%, respectively. Besides, the percentage of donating of people in 26-35 age-group declined from 32% to 24%.
In 1990, 35% and 32% of people giving money to charity were in 51-65 and over 65 age-group, respectively. These figures of both groups increased to 39% and 35% in 2010.
Top answer
The bar chart shows the proportion of British people who give (wrong verb form. ) money to charity in five age groups in 1990 and 2010. ) Overall, it is clear that (Read my advice.
- The bar chart shows the proportion of British people who give (wrong verb form.
- ) money to charity in five age groups in 1990 and 2010.
- ) Overall, it is clear that (Read my advice.
- Delete these words) the percentage of people between 36 and 50 giving money to charity was the highest.
- The percentage of people donating money in 1990 was greater than in 2010 .
Get the Weekly English Kit 📬
New words, one handy idiom, and a 2-minute quiz — delivered to your inbox to keep your streak alive.
The bar chart shows the proportion of British people who give (wrong verb form. The data is in the past, not present.) money to charity in five age groups in 1990 and 2010. (What are these age groups?)
Overall, it is clear that (Read my advice. Delete these words) the percentage of people between 36 and 50 g
 Related Questions