
Please review my IELTS essay - Writing Task 1. Yours sincerely!
The given bar graph depicts the percentages of five Australian cities' population who bought and drank coffee and tea in last four weeks.
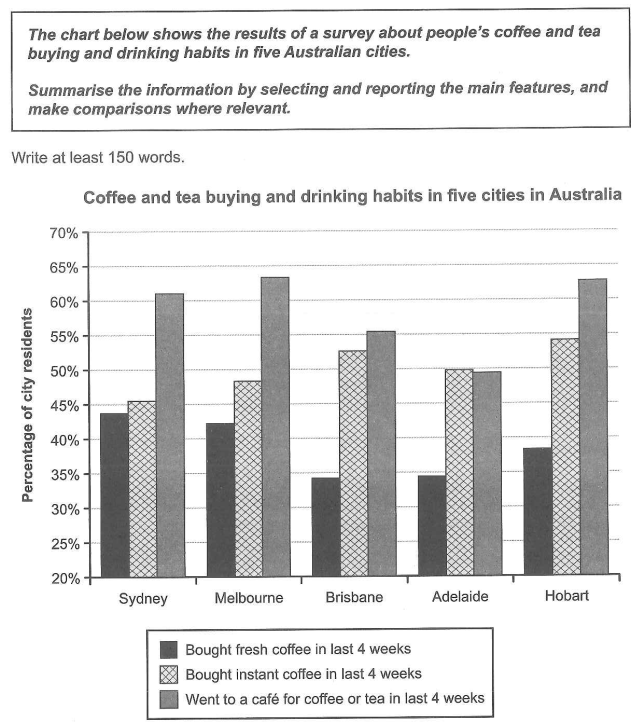
In general, there was a noticeable fluctuation in the percentages of the consumption of coffee and tea among citizens from Sydney, Melbourne, Brisbane, Adelaide, and Hobart.
The percentage of the population bought fresh coffee in both Sydney and Melbourne was around 43%, while the figures for Brisbane and Adelaide were significantly down to below 35%. Hobart's citizens bought fresh coffee over 33% in total.
Moreover, the percentages of five cities' inhabitants who bought instant coffee were notably fluctuated, with the highest figure for Hobart to nearly 55%, whereas Brisbane's was around 53%. Both Melbourne and Adelaide were 48% and 50%, respectively, while Sydney's percent was lowest at above 45%.
Finally, the figure for residents who went to a café for coffee or tea remained steady at 50% in Adelaide, while Brisbane got slight growth to over 55%. This trend continued strongly in Sydney, where it got over 60%, whereas the percentages of Melbourne and Hobart's population who drank coffee were approximately 63%.
Top answer
The given (Do not use "given" or "provided" or anything else. ) in last four weeks. (Your description is not good.
- The given (Do not use "given" or "provided" or anything else.
- ) in last four weeks.
- (Your description is not good.
- There are three values that are plotted: percentage buying fresh coffee, percentage buying instant coffee and percentages going to a cafe.
- Besides, your paragraph is not complete.
Get the Weekly English Kit 📬
New words, one handy idiom, and a 2-minute quiz — delivered to your inbox to keep your streak alive.
The given (Do not use "given" or "provided" or anything else. It is not natural English.) bar graph depicts the percentages of five Australian cities' population who bought and drank coffee and tea (This is not possible to describe in one sentence.) in last four weeks. (Your description is not good. There are three valu
Sample essay:
Note: The description of the data which is plotted on the bar chart cannot be done in one sentence. It is too complex. You have to write a background sentence that describes the survey questions.
A survey was conducted in Adelaide, Brisbane, Hobart, Melbourne, and Sydney asking residents if they had purchased tea or coffee in the past four weeks. The bar chart p
 Related Questions