
Please review my IELTS essay thanks ;3
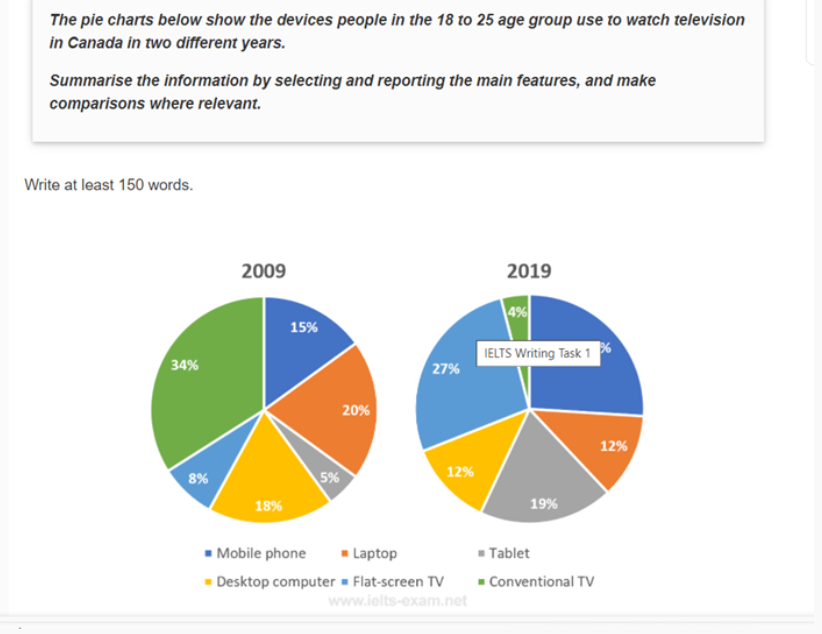
The pie charts represent the gadgets that people were between 18 and 25 years old used to watch television in Canada (mobile phones, laptops, tablets, deckstop computers, flat-screen televisions and conventional televisions) in two years 2009 and 2019.
Overall, the percentage of people using conventional television decreased the most significantly from 2009 to 2019. Whereas flat-screen television watchers's proportion increased the most considerably.
The ones that declined in percentage were conventional televisions, desktop computers and laptops. The proportion of people using conventional televisions accounted for about a third of the total in 2009 then went down notably to 4%. Desktop computers users had a slight decrease from 18% in 2009 to 12% in 2019. The laptops users also had a small reduction about 8% in 2019.
The others rose in percentage. Flat-screen users went up by 19% in 2019 and accounted for approximately a quarter. The mobile phones's percentage was a quarter as well in 2019 (27%). Tablet users's proportions rose from 5% in 2009 to 19% in 2019, nearly a half of the 2019 chart.
P/s : Thank you, the teacher who always helps me with my writing. :3
Get the Weekly English Kit 📬
New words, one handy idiom, and a 2-minute quiz — delivered to your inbox to keep your streak alive.
 Related Questions