
Please review my IELTS essay thanks ;3
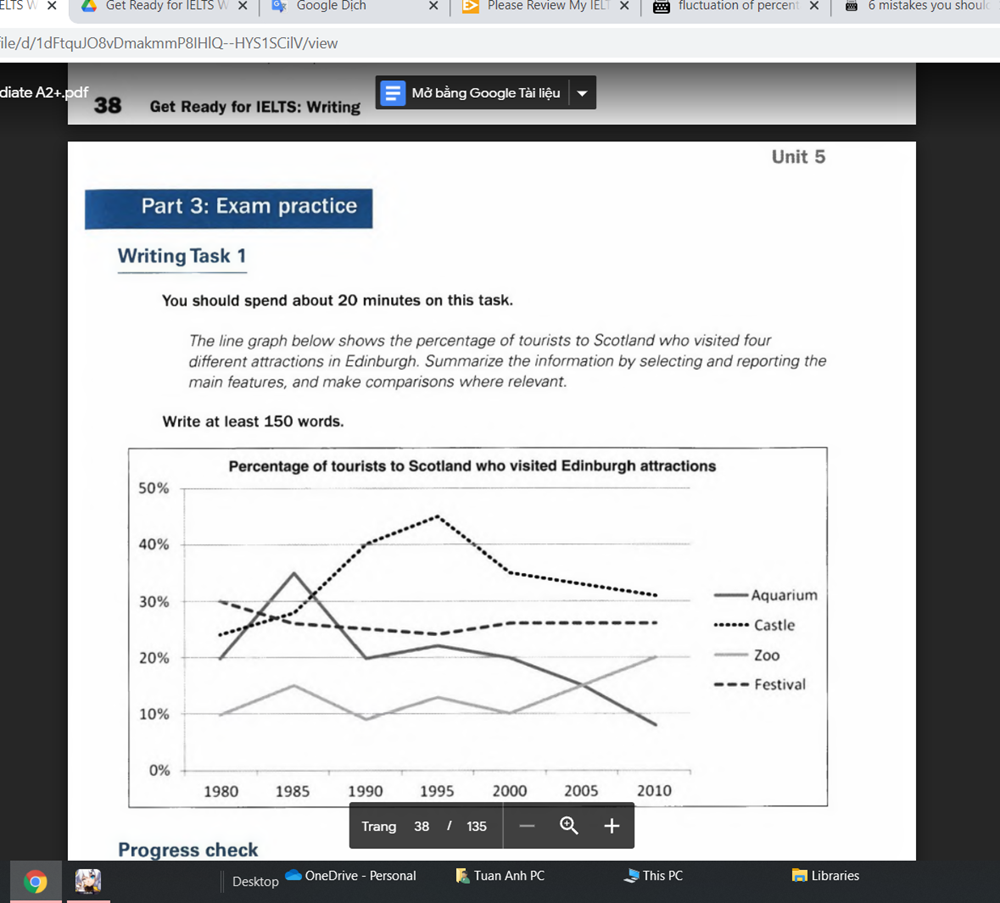
The line graph compared how many tourists (in percentage) that visited four different places of interest in Edinburgh over a thirty-year period from 1980 to 2010.
Overall, three destinations were aquarium, zoo, catsle had an enormous fluctuation in percentage of tourists. However, the percentage of tourists of festival had the most insignificant fluctuation.
The percentage of tourists who went to aquarium rose significantly from 20% in 1980 to about 45% in 1985 then went down rapidly to 20% again in 1990. It had a small fluctuation between 1990 and 2000 then decreased fast. The percentage of tourists who visited castle had an upward trend between 1980 and 1995 and increased considerably from near 30% in 1985 to over 40% in 1995. But from 1995 to 2010 it kept falling down. The percentage of tourists who went to zoo kept going up and down consecutively until starting to have an upward trend from 2000.
The percentage of tourists who paid a visit to festival gradually decreased from 1980 to 1995 then slowly increased in 2000 and stayed the same. The percentage was always not higher than 30%.
Top answer
Please read my advice for Task 1 essays: IELTS TASK 1: Hints, Tips And Advice Vocabulary Words For Task 1: Reference Post
- Please read my advice for Task 1 essays: IELTS TASK 1: Hints, Tips And Advice Vocabulary Words For Task 1: Reference Post
Get the Weekly English Kit 📬
New words, one handy idiom, and a 2-minute quiz — delivered to your inbox to keep your streak alive.
The line graph compared (use present tense.) how many tourists (as a percentage of all tourists) that visited four different places (Name these places in the opening paragraph.) of interest in Edinburgh
 Related Questions