
Please review my IELTS essay thanks ;3
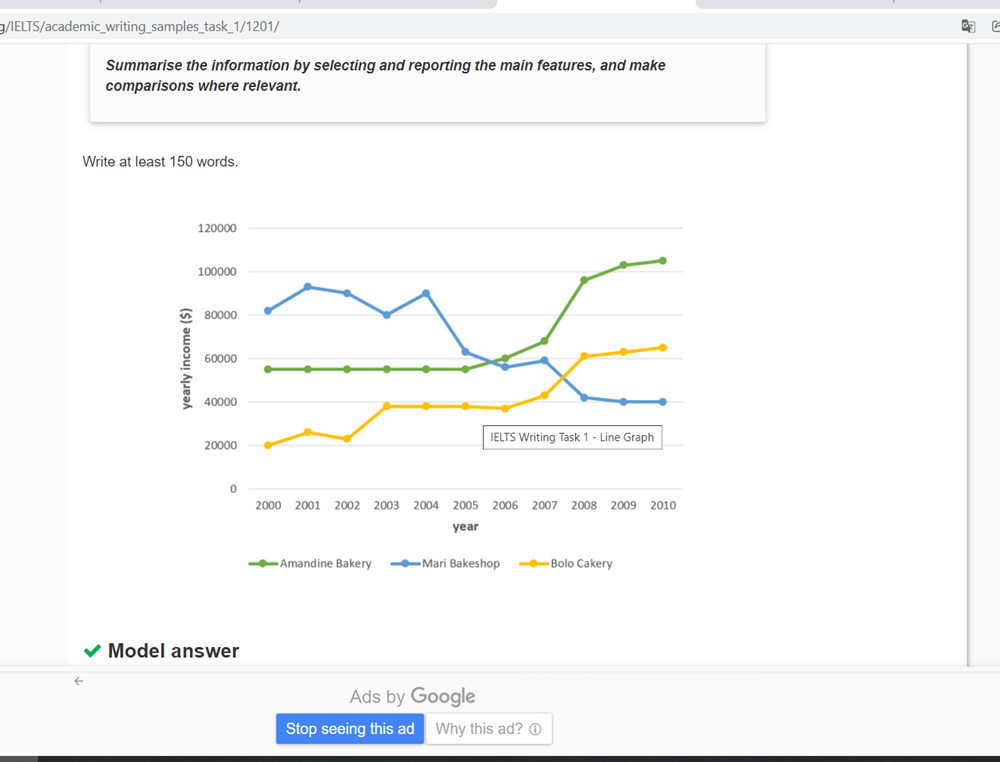
The graph manifests data about yearly revenue of three bakeries in Calgary over a ten years period from 2000 to 2010.
Overall, Amandine Bakery and Bolo Cakery showed an upward trend in their annual salary. But Mari Bakeshop's revenue showed an downward trend which was contrary.
As for Amandine Bakery, their income showed no upward or downward trend over a five years period from 2000 to 2005 (under 60000 dollars in revenue) then gradually went up until 2007 when rose significantly in 2008 then went up slowly. Bolo Bakery had two peaks, one in 2003 with 40000 dollars and one in 2008 with a number that was even higher was over 60000 dollars in revenue. However, it varied from 2000 to 2002. But generally, the revenue kept rising.
Mari Bakeshop's earnings was unsteady and had no clear highest point in revenue. But still their highest revenue was near 100000 dollars in 2001 and 2004. Their earnings kept falling down rapidly in general.
Top answer
Please post essays, paragraphs, dialogues and other writing in the essay forum so a moderator does not have to move your post. Click on this link: Next, tap on the green button "write a new post" --------------------- Please read my advice for Task 1 essays: IELTS TASK 1: Hints, Tips And Advice Vocabulary Words For Task 1: Reference Post
- Please post essays, paragraphs, dialogues and other writing in the essay forum so a moderator does not have to move your post.
- Click on this link: Next, tap on the green button "write a new post" --------------------- Please read my advice for Task 1 essays: IELTS TASK 1: Hints, Tips And Advice Vocabulary Words For Task 1: Reference Post
Get the Weekly English Kit 📬
New words, one handy idiom, and a 2-minute quiz — delivered to your inbox to keep your streak alive.
The graph manifests (Not a good word choice) data about (That is not good. What exactly is on the graph?) the yearly revenue of three bakeries in Calgary over a ten years (wrong form. "ten-year") period from 2000 to
Sample essay:
The line graph compares the annual income of three bakeries in Calgary, Amandine Bakery, Mari Bakeshop and Bolo Cakery, between 2000 and 2010.
Overall, in 2000, Mari Bakeshop surpassed the other two in revenue, with Amandine Bakery coming in second and Bolo Cakery third. Amandine showed a large increase and was in top position in 2010, with Bolo Cakery second and
 Related Questions