
Please review my IELTS essay thanks ;3
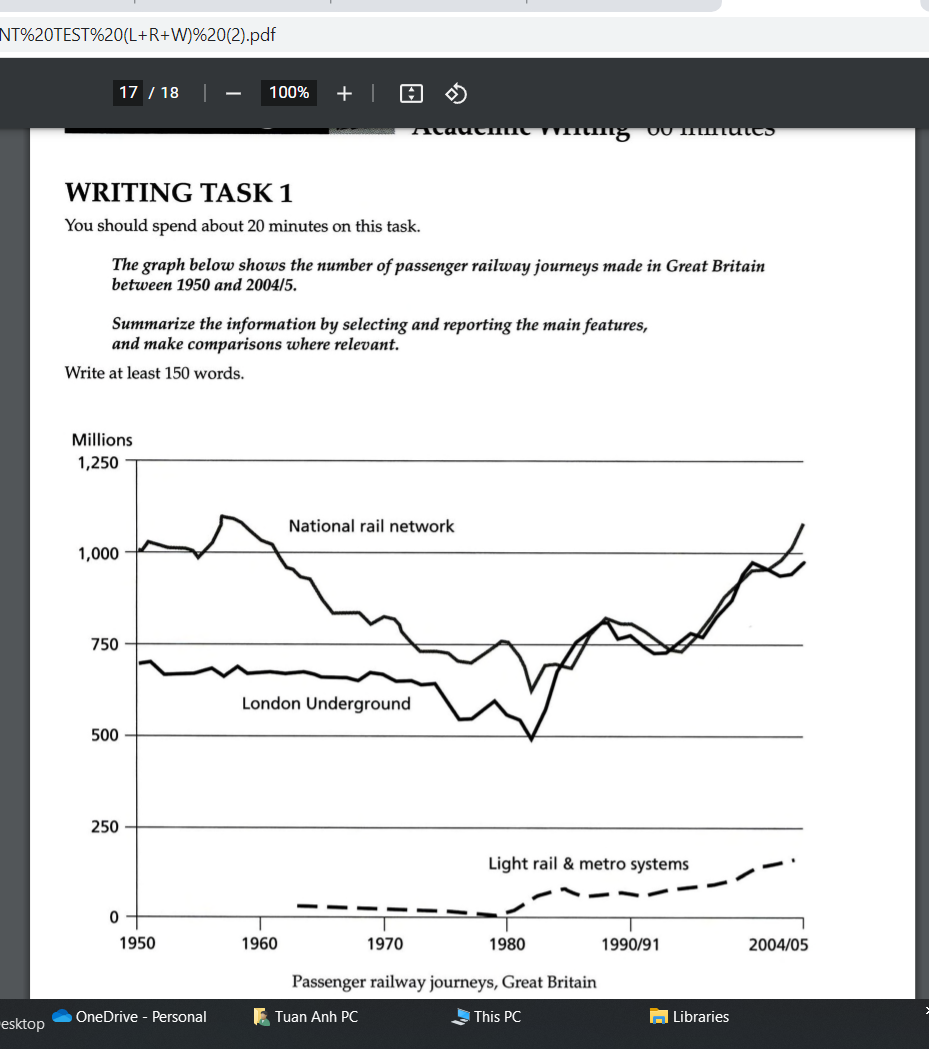
The graph below shows the number of passenger (in milions) took their journey by 3 railway systems (National rail network,London Underground and Light rail and metro systems) in Great Britain from 1950 to 2004/5.
Overall,the number of passenger of the National rail network and the London Underground fluctuated.However,the passenger of the Light rail and metro systems showed an upward trend.
The passengers of the National rail network and the London Underground had quite equivalent fluctuation.Both dropped drastically in the 80s but then reached their peak in the 90s at the same time.But the National rail network's highest peak was in 60s and the London Underground was in the 90s.
The passengers only started going by the Light rail and metro systems in the 60s.The number gradually went down from the 60s to the 80s then went up rapidly in the middle of the 80s and the 90s and was stable from now on.
p/s : could i write my essay in a piece of paper then post on the forum?
Top answer
Please read my advice for Task 1 essays. IELTS TASK 1: Hints, Tips And Advice Vocabulary Words For Task 1: Reference Post
- Please read my advice for Task 1 essays.
- IELTS TASK 1: Hints, Tips And Advice Vocabulary Words For Task 1: Reference Post
Get the Weekly English Kit 📬
New words, one handy idiom, and a 2-minute quiz — delivered to your inbox to keep your streak alive.
Your writing is not well organized. Read my advice. Write three paragraphs.
The graph below shows the number of passenger (wrong form) (in milions) (wrong spelling - copy the units correctly!) took their journey
 Related Questions