
Please review my IELTS essay. Thank you and have a nice day
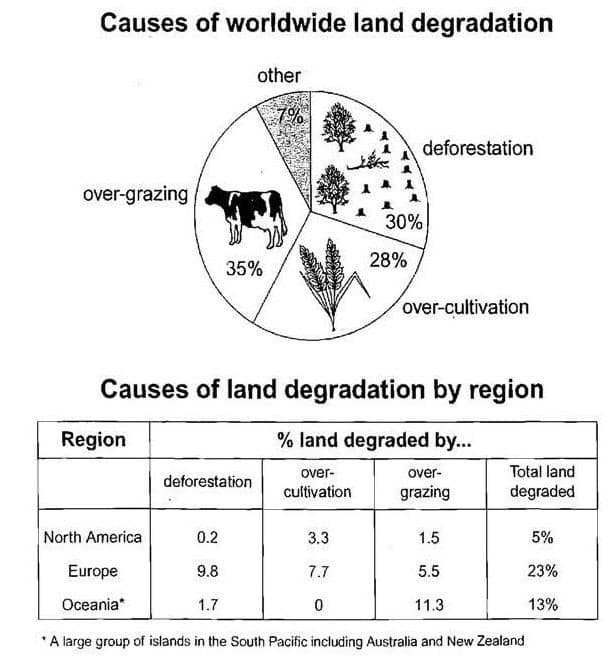
The pie chart illustrates the percentage of four activities that degraded the farmland around the world in the 1990s. And the table compares the proportion of these activities affected North America, Europe and Oceania in the same period.
In generally, two main reasons causing land’s quality decrease are over-grazing with 35 percent and deforestation with 30 percent. A further 28 percent of global degradation is beacause of over-cultivation. And other reasons occupy 7 percent.
These causes engendered several regions in the 1990s. In the 90s, Europe was the area most affected by degradation with total 23% land degraded. Due to deforestation with 9,8% and over-cultivation with 7,7 percent. Followed up is Oceania is 13% in total of farmland quality deterioration.The reasons for this are grazing too much animal and cutting down too much tree. And finally ,North America has the lowest proportion of land degraded at only 5%, the main causes were over-cultivation and over-grazing.Overall, it is clear that Europe was most affected by land degraded than North America and Oceania, and the main reasons were deforestation and over-cultivation.
Get the Weekly English Kit 📬
New words, one handy idiom, and a 2-minute quiz — delivered to your inbox to keep your streak alive.
 Related Questions