
Please review my IELTS essay. Thank you!
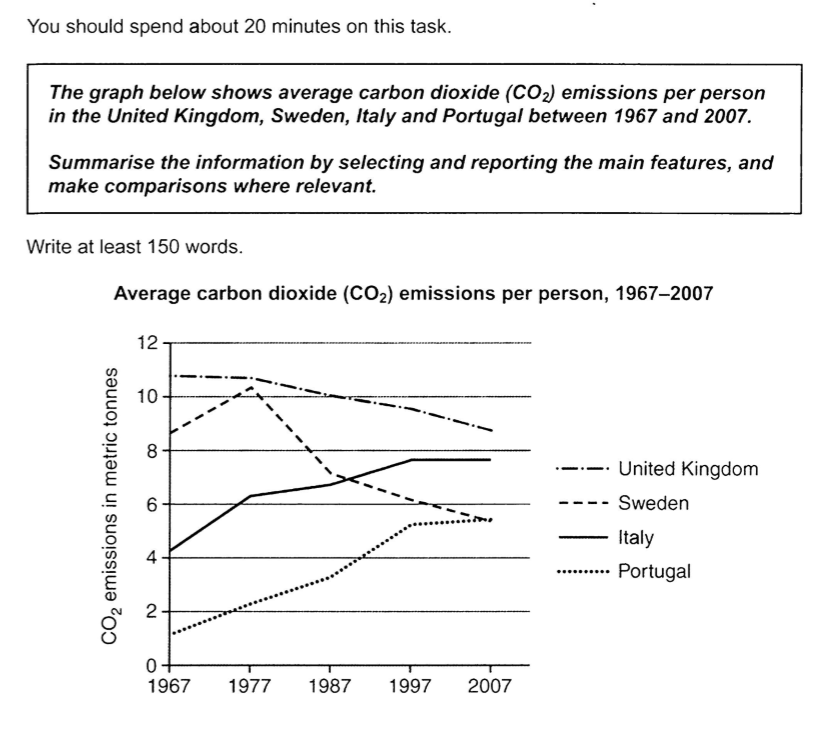
The line graph compares the changes in terms of the average amount of carbon dioxide that a person emitted in the United States, Sweden, Italy and Portugal in a 70-year-period, commencing from 1967.
Overall, what stands out from the graph is that there were significant upward trends in the amount of Italy and Portugal, while the carbon dioxide emissions per person in the United Kingdom and Sweden saw a considerable fall over the period.
As regards Italy and Portugal, they had a similar point of stable increase. The amount of carbon dioxide that a person released in Italy suddenly rose from 4 to more than 6 metric tonnes, at which point it gradually grew by nealy 2 metric tonnes and reached the peak at under 8 metric tonnes in 1997. There was a substantial rise in the figure of Portugal by almost 4 metric tonnes from 1967 to 1997, after which it levelled off at under 6 metric tonnes in 2007.
In contrast, the United Kingdom and Sweden had downward trends. The amount of carbon dioxide emissions in the United Kingdom fell sharply over the period, starting from around 11 to 9 metric tonnes. Having climbed abruptly by about 2 metric tonnes until 1970, the share of Sweden dramatically slumped to 7 metric tonnes in 1987 and slightly dropped by around 1 metric tonnes until finishing at under 6 metric tonnes in 2007.
Top answer
You wrote 233 words. That's no good. 1- You do not have time to write so many words in the exam.
- You wrote 233 words.
- That's no good.
- 1- You do not have time to write so many words in the exam.
- 2- It tells the examiner that you cannot summarize.
- Try again.
Get the Weekly English Kit 📬
New words, one handy idiom, and a 2-minute quiz — delivered to your inbox to keep your streak alive.
You wrote 233 words. That's no good.
1- You do not have time to write so many words in the exam.
2- It tells the examiner that you cannot summarize.
Try again. Aim for 150-160 words.
 Related Questions