
Please review my IELTS essay. Thank you!
The charts below show the changes in ownership of electrical appliances and amount of time spent doing housework in households in one country between 1920 and 2019.
Summarise the information by selecting and reporting the main features, and make comparisons where relevant.
The line charts compare the proportion of owning household devices including washing machine, refrigerator, vacuum cleaner and the duration of housework done by family in one nation in a 99-year-period, commencing from 1920 to 2019.
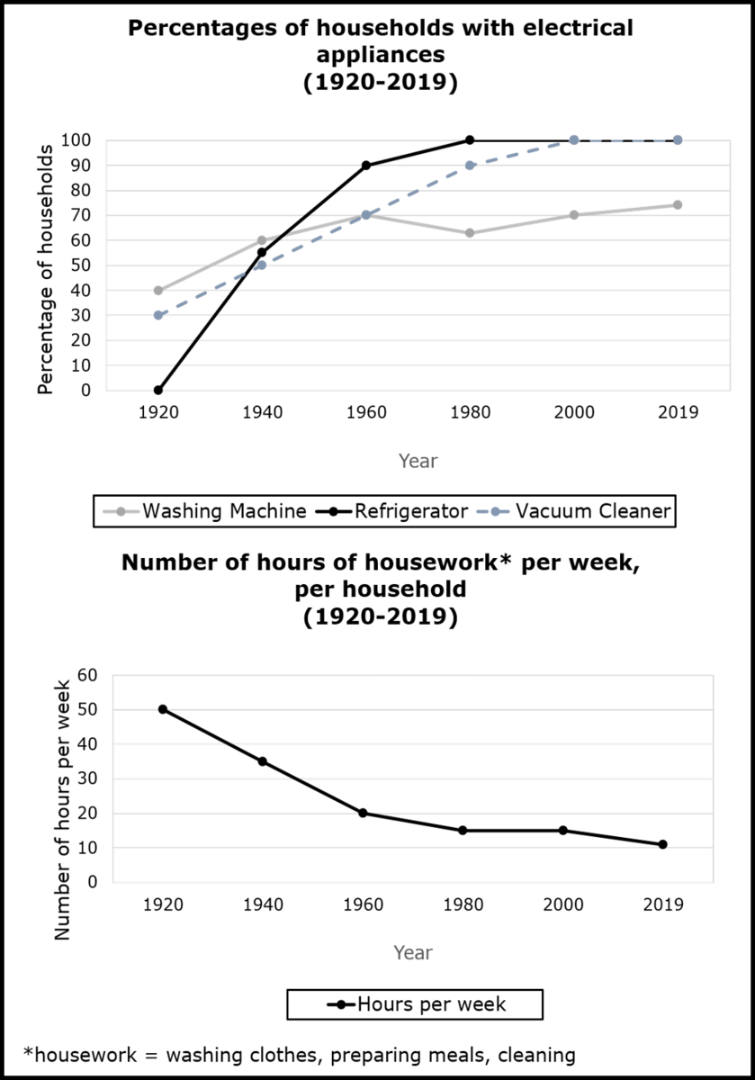
Overall, the possession of household machines had an upward trend with washing machine and refrigerator being owned by every family. In contrast, the amount of time people spent with housework had a downward trend.
In the first line chart, refrigerator became a rare commodity in 1920; however, in the following 20 years, the percentage began to suddenly soar to approximately 55% and reached the peak in 1980. It is noticeable that it still remained on the highest point until 2019. The proportion of families possessing vacuum cleaners accounted for 30% and steadily climbed in the next 60 years and peaked in 2000. Besides, washing machines appeared to rank first in 1920 with 40% but it slightly increased, ranging from 50% to almost 75%. The striking point is that it had an erratic decrease in 1980.
The second line chart indicates a correlation between the acquisition of essential household tools and the amount of work required to be done at home. Starting from 1920 to 1960, the number of hours that were allocated for housework witnessed a significant drop by 30%, from 50 hours to 20 hours. Looking at the remaining period, it merely fell by a small fraction with the slow speed.
Top answer
The first line cha rt compare tracks the proportion of owning household s devices including who owned a washing machine, refrigerator, or vacuum cleaner and the duration of housework done by family in one nation in a 99-year-period, commencing from over the years 1920 to 2019. The second shows the number of hours spent on various household chores over that same period. Overall, the possession percentage of household s with appliances saw machines had an upward trend but a plateau towards the end.
- The first line cha rt compare tracks the proportion of owning household s devices including who owned a washing machine, refrigerator, or vacuum cleaner and the duration of housework done by family in one nation in a 99-year-period, commencing from over the years 1920 to 2019.
- The second shows the number of hours spent on various household chores over that same period.
- Overall, the possession percentage of household s with appliances saw machines had an upward trend but a plateau towards the end.
- with washing machine and refrigerator being owned by every family.
- In contrast, the amount of time people spent with doing housework had a downward trend.
Get the Weekly English Kit 📬
New words, one handy idiom, and a 2-minute quiz — delivered to your inbox to keep your streak alive.
The first line chart compare tracks the proportion of owning households devices including who owned a washing machine, refrigerator,
 Related Questions