
Please review my IELTS essay task 1. Thank you ~
My essay:
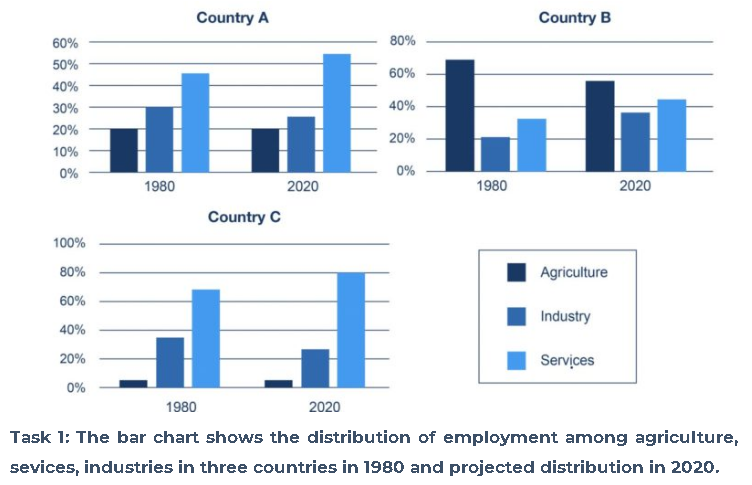
The bar charts compare the percentage of labour force in three sectors: agriculture, services, and industry in three countries in 1980 and 2020.
Overall, the rank of three sectors in three countries are expected to be the same with services being the highest in country A and C, and agriculture being the highest in country B. It is projected to have an increase in services sector in all three countries.
Country A and country C are expected to share the same trend in the distribution of employment. The percentage of employment in agriculture will level off in country A and country C at 20% and 5% respectively. There will be a decrease in the proportion of employment in industry sector, by 5% in country A and 10% in country B by 2020. The numbers are expected to transfer to services sector where they are anticipated to finish at 55% in country A and 80% in country C.
In country B, it is expected the percentage of employment in agriculture will fall from 70% in 1980 to reach 55% in 2020. In contrast, the percentage of employment in industry and services sector will increase, finishing at 35% and 45% respectively in 2020.
Top answer
The charts do not make sense. The total employment across all three sectors should add up to 100%. It could be less if there was some other sector that was not included.
- The charts do not make sense.
- The total employment across all three sectors should add up to 100%.
- It could be less if there was some other sector that was not included.
- Country A is OK, but the total for Country B adds up to more than 100%.
- Where did you get this exercise?
Get the Weekly English Kit 📬
New words, one handy idiom, and a 2-minute quiz — delivered to your inbox to keep your streak alive.
The charts do not make sense. The total employment across all three sectors should add up to 100%. It could be less if there was some other sector that was not included. Country A is OK, but the total for Country B adds up to more than 100%. Where did you get this exercise?
Compare with these similar Task 1 exercises - the country totals add up to 100$ or slightly less.
 Related Questions